Signed and normal areas
We already know that there are two types of areas, the area (which is the "normal" area we already know), and the signed area, which is the sum of bar areas, or the integral. As long as the graph of defining the border of the area is above the -axis, the area and the signed area are equal. However, as soon as the graph of is below the -axis, the bar area becomes negative, and the sum of the bar areas is a mixture of positive and negative numbers - which does not correspond to the "normal" area. The figure below illustrates this point:
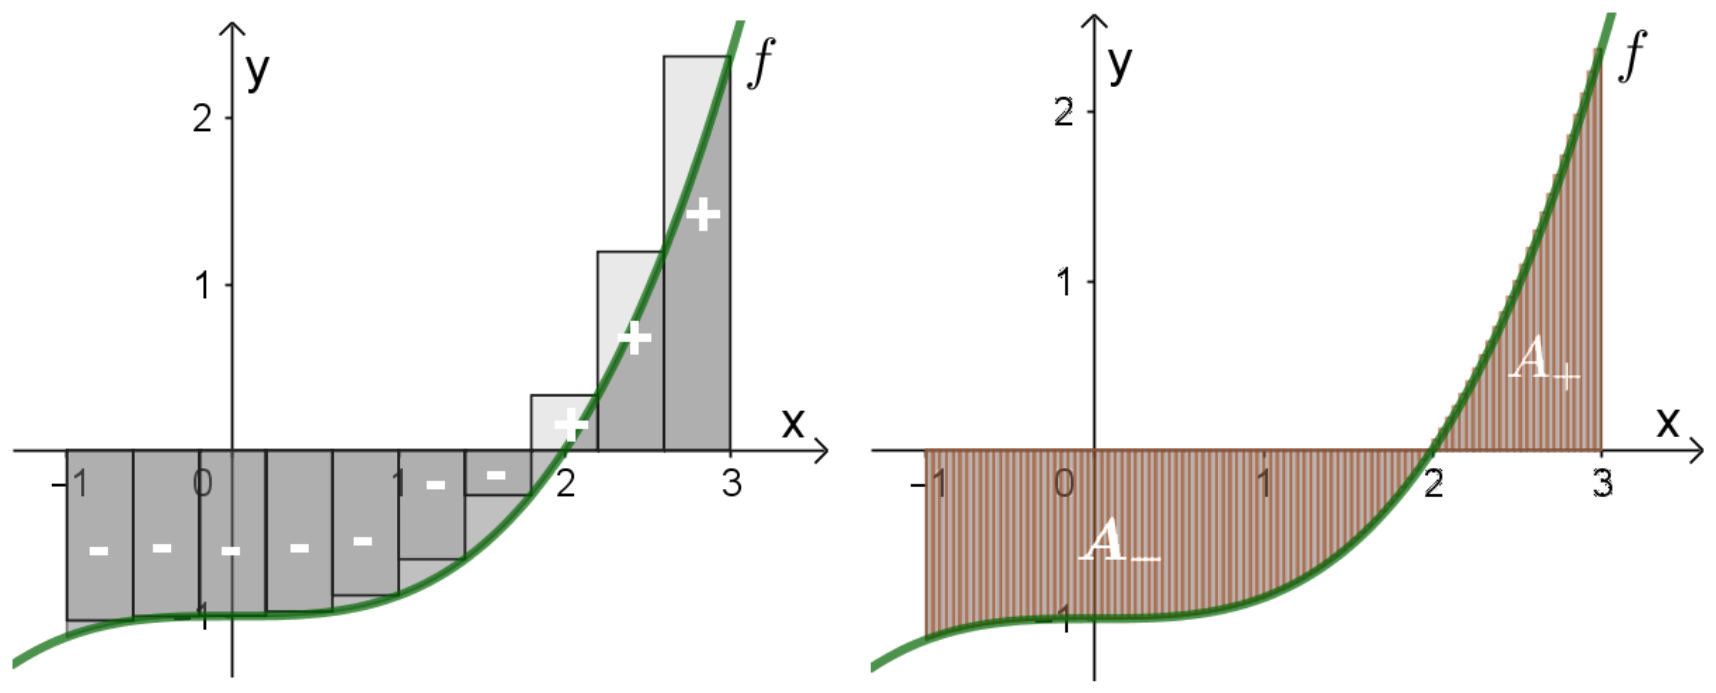
So if we want to have the area (the normal one, all positive), we have to divide the negative and positive parts, and determine their integral separately. For the picture above, we have to determine the area
and
As is the sum of only negative bar areas, the integral will be negative, but its positive part will be the (normal) area of the region from to . is the sum of only positive bar areas and the integral is already the (normal) area. Thus, the total (normal) area of the shaded region is the sum of the positive numbers:
Here, the vertical lines means that we have to take the absolute value of , which simply means to take the positive part of the number.
Of course we can generalise this to arbitrary many positive and negative subregions.
The function equation of the graph shown above is
Find the (normal) area of the region enclosed by the graph of , the -axis, and the vertical lines at and .
Solution
We first need to find the -intercept of . For this example it is obviously , which also follows from
The antiderivative of is
We then have
and
Thus, the (normal) area of the region is
Note that if add , we get , which is simply the integral of from to . Indeed:
Q1
Consider the function .
- Determine
- Determine the area of the region enclosed by the graph of , the -axis, and the vertical lines at and .
Q2
The region is enclosed by the graph of , the -axis and the vertical lines at and .
-
Determine the signed area .
-
Determine the area of .
Solution
A1
The antiderivative of is
-
-
Draw graph (see below) to check if there are negative regions - indeed there are! We calculate the three regions separately. First we need to find the -intercepts of : Find with
Now we determine the areas with the integral:
Thus, the area is
Let's check if we get the result of (1), if we simply add the areas. Indeed, we have
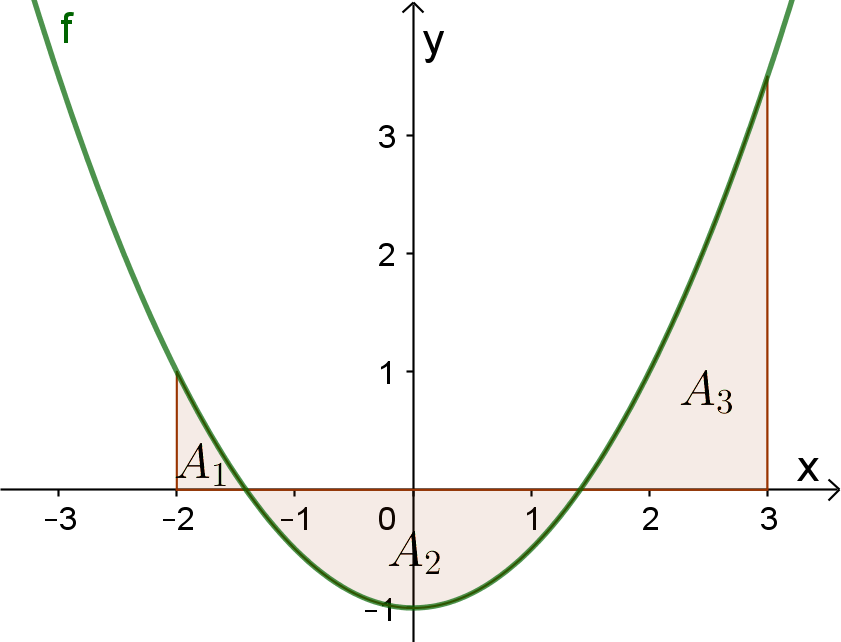
A2
Draw the situation! Because of
the antiderivative is
-
.
-
We have to calculate the negative and positive areas individually. First we need to find the -intercepts of : Find with
Clearly, this has to be at and . Thus, we have the three areas
Thus, the area is