Frequency distribution of discrete data
To find the frequency distribution of a discrete dataset, we simply count how often each possible value occurs. For example, let's a roll a fair die once, set ="observed number" and choose . The data set might look as follows:
The frequency distribution of the data set is shown in a table:
Note that we typically express the counts as relative frequencies or percentages of the total number of data points in the set. We can also produce a graph of the frequency table (using the relative frequencies), the so called bar chart. The possible values in the data set are indicated along the -axis, and the relative frequencies along the -axis:
How does the bar chart look like if there are a lot more data points in the set, say ? In other words, what happens if we repeat the experiment times? Well, the relative frequencies would approach the probabilities for observing a , thus we then have
which is the probability function of the random variable :
Let us summarise:
Consider a discrete data set produced by a random experiment that is repeated times, and a discrete random variable with the possible outputs :
Let be the relative frequencies of the values in the data set (the bar chart of the data set). Then the relative frequencies of the data points in the data set approximate the probability function of , that is
The larger the data set (that is, ), the better is this approximation.
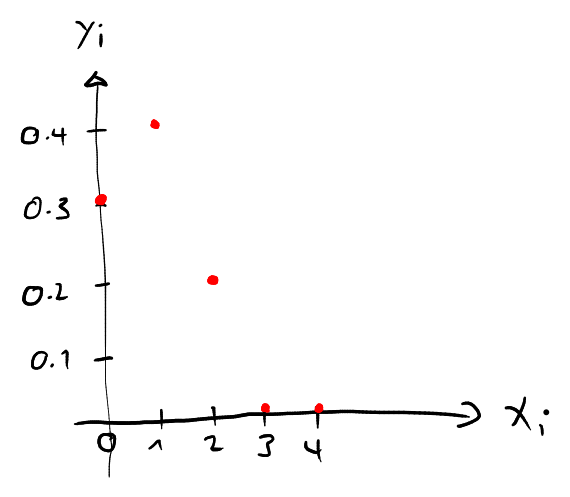
A coin with is tossed times. Let ="number of heads". The experiment is performed times. Determine the approximate frequency distribution of the data set and sketch the bar chart.
Solution
This is a binomial experiment, where and the probability of success is . So we have
If we run the experiment times, randomly takes the values ,,,, and . The is assumed in of these experiments (relative frequency , so absolute number is ), the is assumed in of the cases (relative frequency 0.422, absolute number ), and so on. So we have the following frequency table:
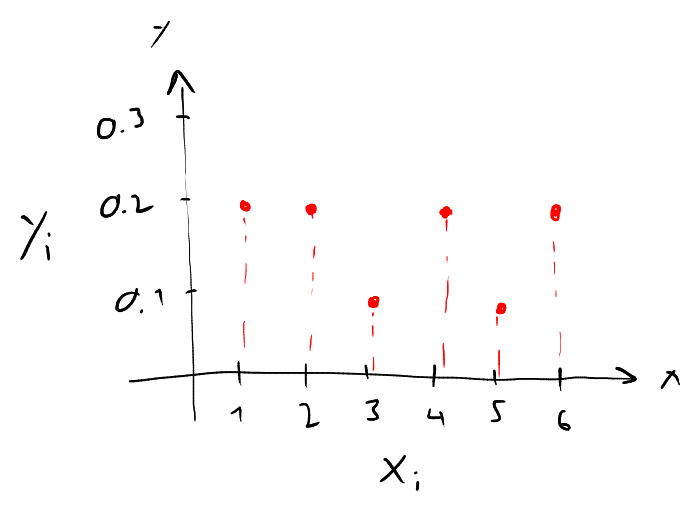
These are only approximate values, since the probabilities only give the percentages if the number of experiments is extremely high, much higher than .