The exact signed area
Given a region from to between the graph of and the -axis, we know how to find an approximation of the signed area using bars of equal width (see the previous sections):
where is the exact area, and the right hand side is a sum of the bar areas, where
- is the width of the bars, that is,
- is the location on the -axis of the -th bar (to be more precise, the location of the right side of the -th bar).
- is the height of the -th bar
- is therefore the area of the -th bar
The more bars we take, the thinner the bars will be because they all have to fit into the interval from to . You can also see this when looking at the formula for calculating the width
And if we cover the region beneath the curve with thinner bars, the sum of their bar areas will approximate better. See the Geogebra app below.
Open in GeoGebra
The function used in the app above is
and the region we are looking at is between and . Move the slider to the right to increase the number of bars . Observe how the sum of bars approaches a specific value (here ) if we use more and more bars, that is, if we let approach infinity. This specific value is denoted by
and is called the integral of f from a to b. With this notation in place, we can write
and we write
to indicate that the integral is the value towards which the sum of bars converge for . The notation is quite intuitive, by the way. It describes the sum of infinitely many bar areas, where the bars have an infinitely small width :
However, unlike , there is no value associated with ... it is just "infinitely small", that is, is bigger than zero, but smaller than any positive number (hmm...). Clearly, there is a lot to be said about , but we will not enter this discussion.
The values and are called the integration limits. The lower number is always at the base of the symbol , the higher number at the top.
It is quite clear, if we play around with the app above, that for increasing the bars cover the region more and more exactly. So the sum of the bars tends towards the oriented area . Thus we can write:
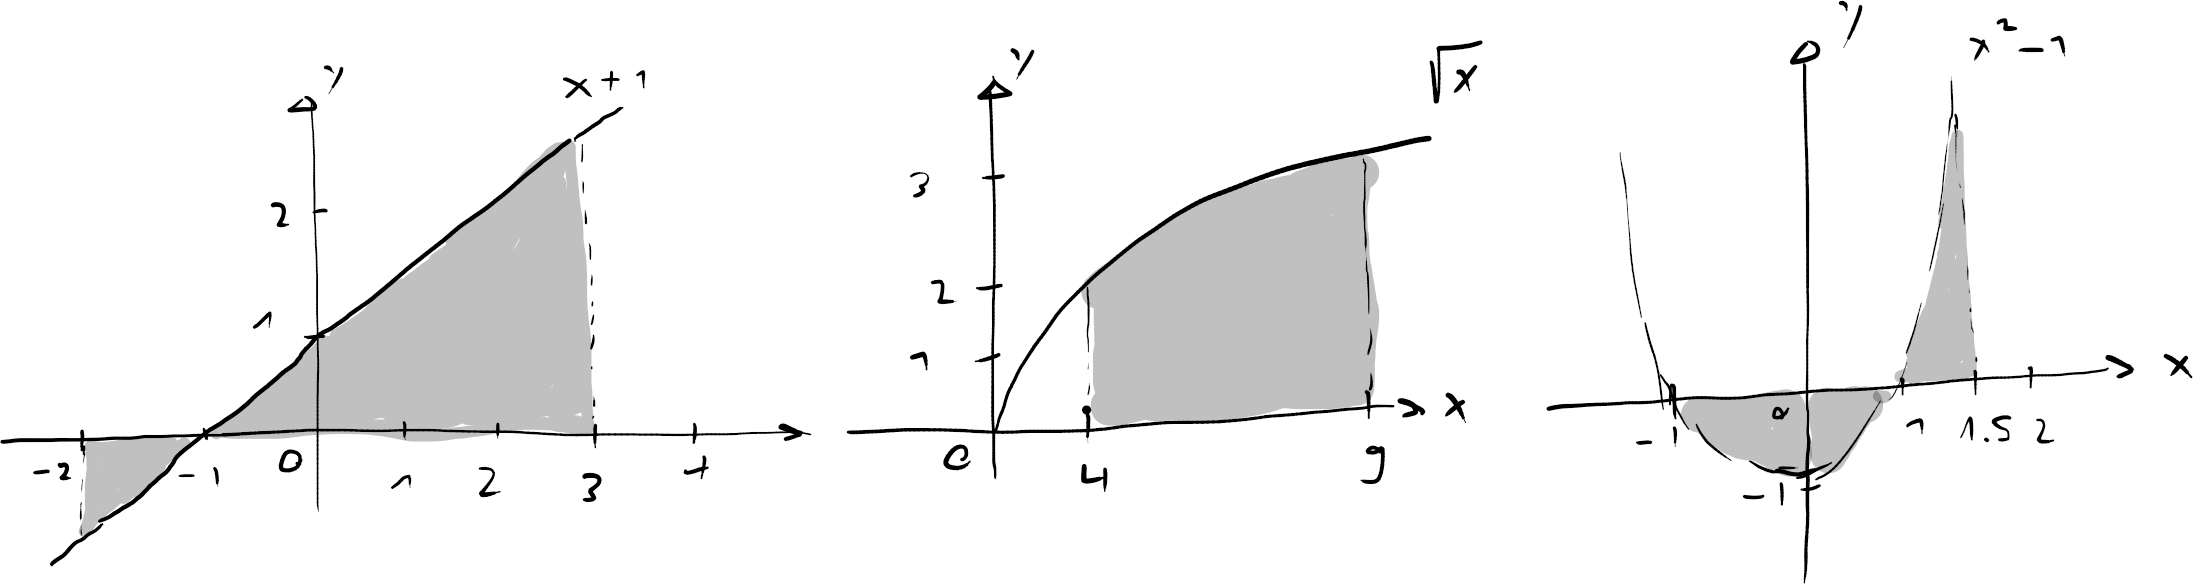
Draw the graph and indicate in the figure (not calculate) the region specified by the integral.
-
-
-
Solution
So, we know now how to find the exact signed area between the graph of and the -axis. But of course we still have a problem: to find the exact area we need to apply sums of bars with higher and higher bar numbers, and thus have to add more and more values. For example, using bars requires the addition of bar areas ... how can we add so many numbers? Even worse, we need to find the sums for bars, where .
Recall that we had a similar problem for finding the slope of the tangent in different calculus. There we had to determine the slope of many secants to find the value towards which these slopes converged, and this value was then the slope of the tangent. We first had to do it the hard way before we found nice differential rules. We will do the same here - first the hard way, then the elegant integration rules!
Here is an example.
Consider the region between the graph of and the -axis, where and . We want to find the exact (signed) area of this region.
-
Approximate using bars and find a formula for the sum of the bars. Hint: you need one of the famous sums, see section 25.
-
Let approach infinity to find the exact value .
-
Determine the exact area by other means and compare with the result above.
Solution
For bars it is
We also have
- Approximating with bars, we get
Note that we have used the sum formula
(see section 2, Exercise 2).
- Now we see that if we get
This is also the area .
- The region is a triangle with base and height . Thus, the area is
Determine
using converging sums of bars.
Solution
We form the sum of bars to approximate the area between the -axis and the graph of , for and . With
we get
and therefore
Note that we have a formula for finding the first square numbers (see section 25):
For we get