Signed areas
Consider the region beneath a graph between and . So far, we looked at examples where the graph was always above the -axis. We discuss now the case where the graph goes below the -axis. See the figure below.
In this case we get subregions (see picture below, left). Assume that the areas of theses subregions are , , and .
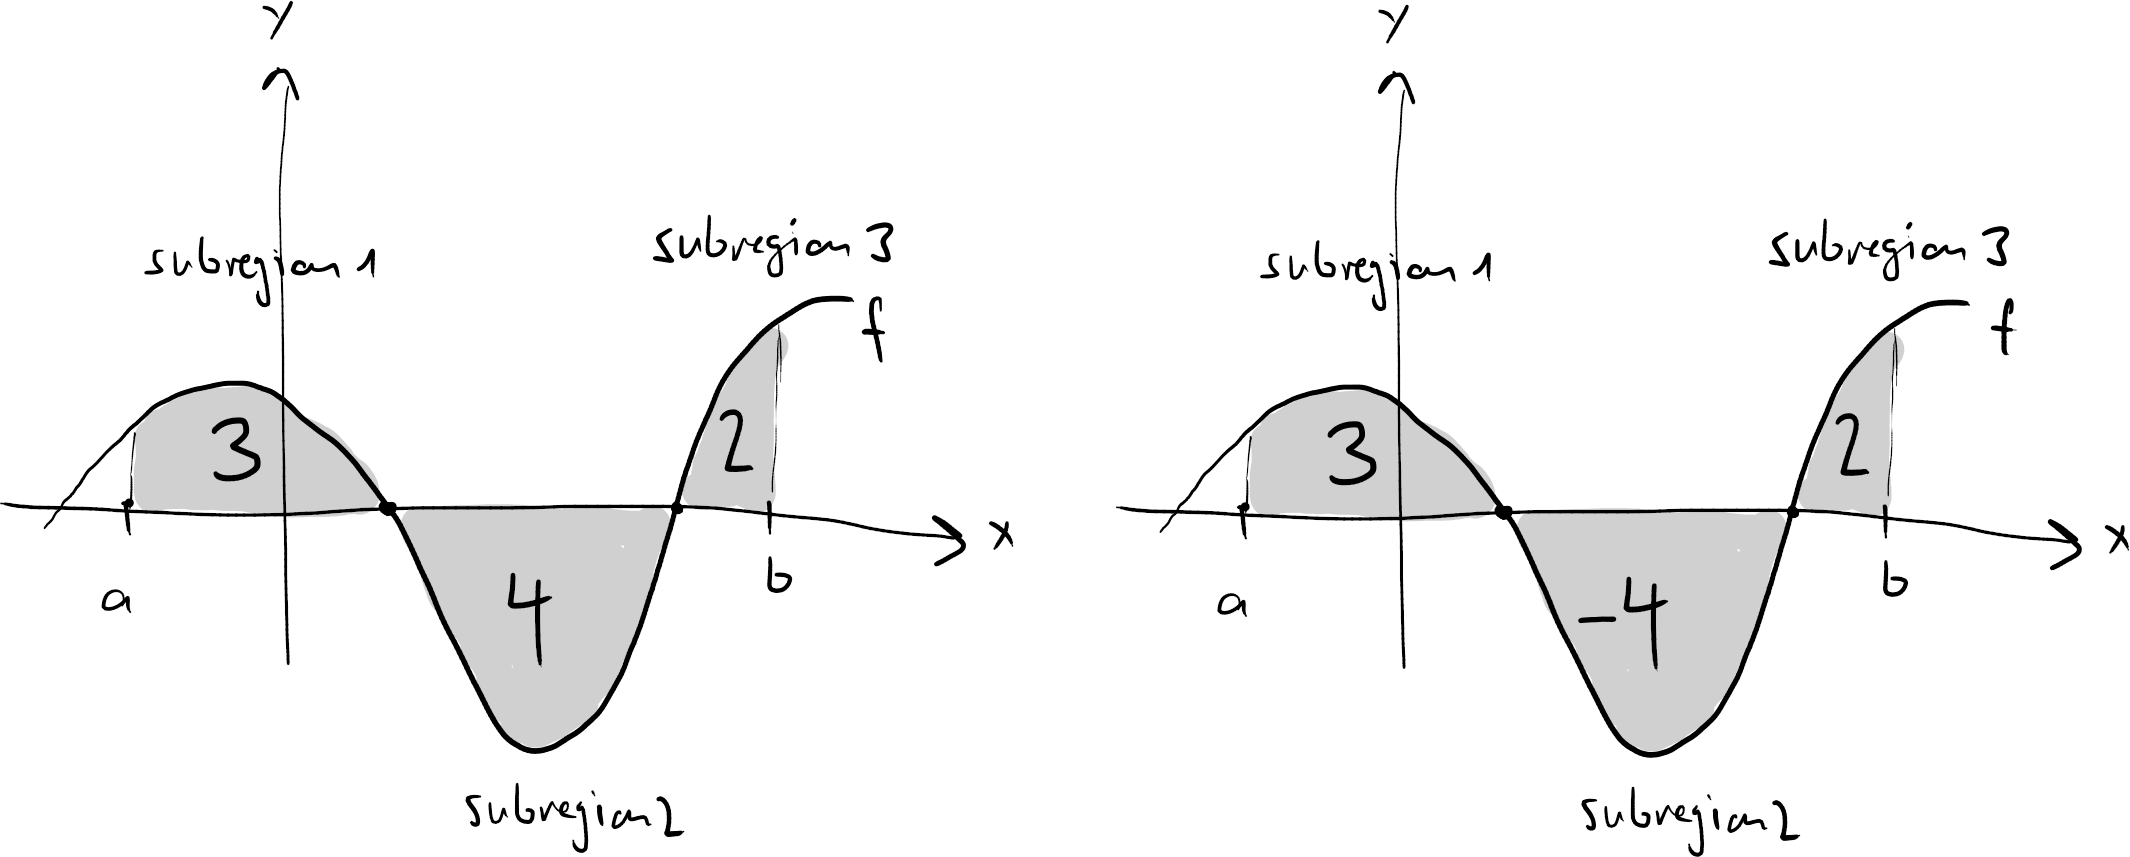
So to find the area of the region between the graph of and the -axis we have to determine the area of each subregion, and add them together (see picture above, left):
However, sometimes we want to count the subregions below the -axis negative (there are many examples in physics, where this makes sense). See picture above, right. In this case, the sum of the areas of all subregions can be negative, positive, or even zero. In our example, we have the
We call this the signed area, and refer to the first one as area or normal area.
So, the area of a region between a graph and the -axis can have two different meanings: the area or the signed area. Which of these areas we are interested in is often stated explicitly in the problem, or should be clear from the situation.
Find the signed area of the region between the graph of and the -axis:
- , where .
- , where .
Hint: Draw the graph.
Solution
Draw the graphs! In both cases the signed area is , because both subregions have the same size (which we do not know yet), but one is counted positive, the other negative. Thus the sum is .
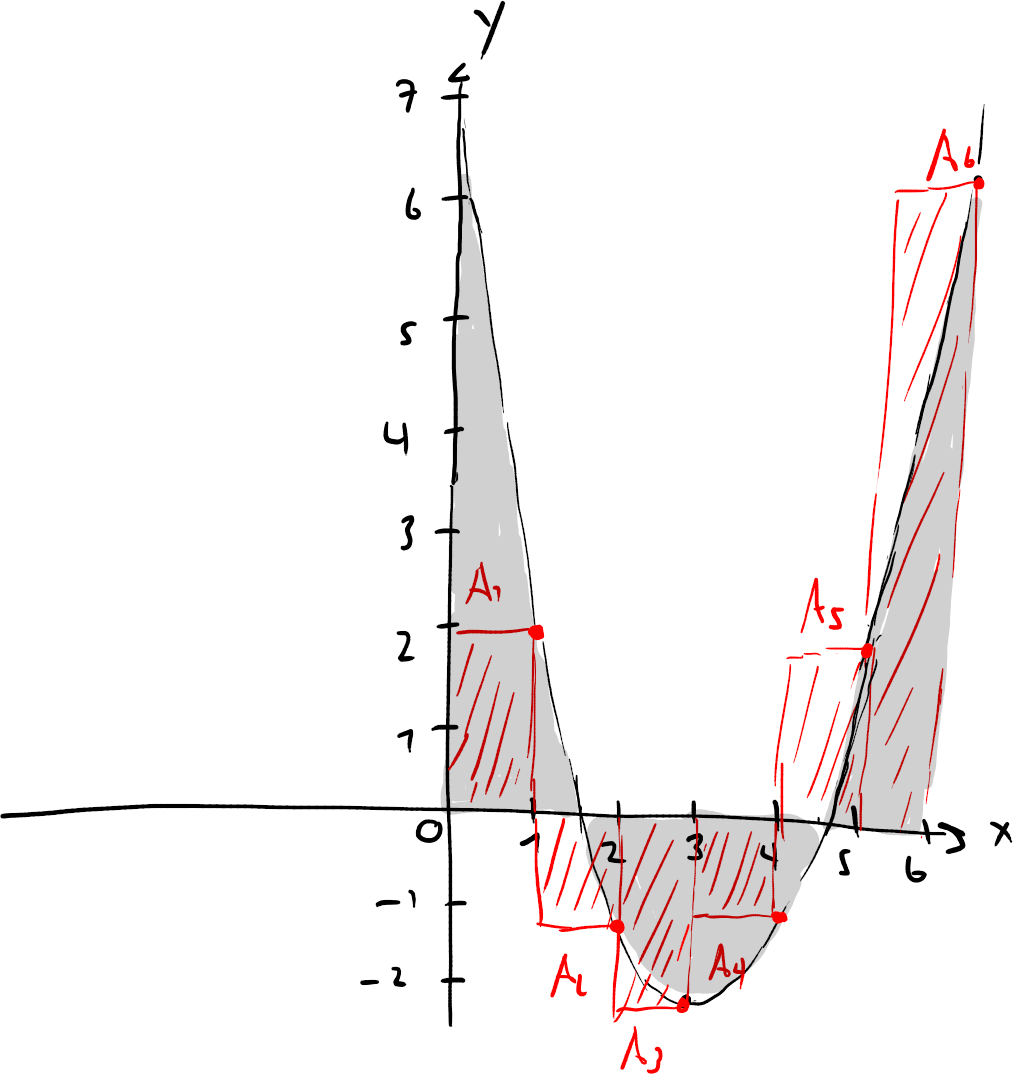
Consider the function
We are interested in the region between the graph of and the -axis for . What area (normal or signed) is approximated by the sum of bars:
where , and , and . Sketch the graph, and the bars, and determine the value of the bar areas.
Solution
The sum of bars approximates the signed area, because the area of a bar is negative if is negative.
It is