The graph of functions
You can think of the graph of a function as its picture, so the graph shows how the function "looks". The way to do this is simple: every input output pair of the function defines a point in a coordinate system, where the -coordinate of the point is the input and the -coordinate is the corresponding output:
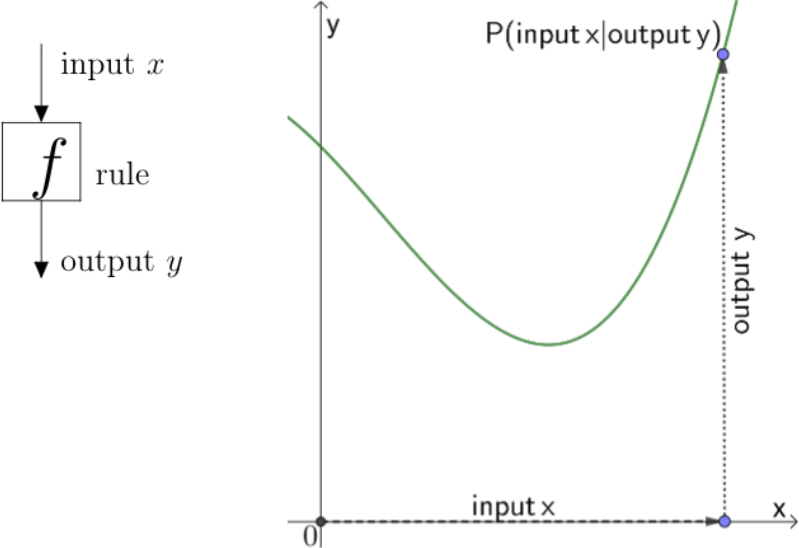
The set of all these points (that is, all possible input-output pairs) is called the graph of the function . Typically, for all the functions we discuss here, the graph forms a nice smooth line (or several smooth lines).
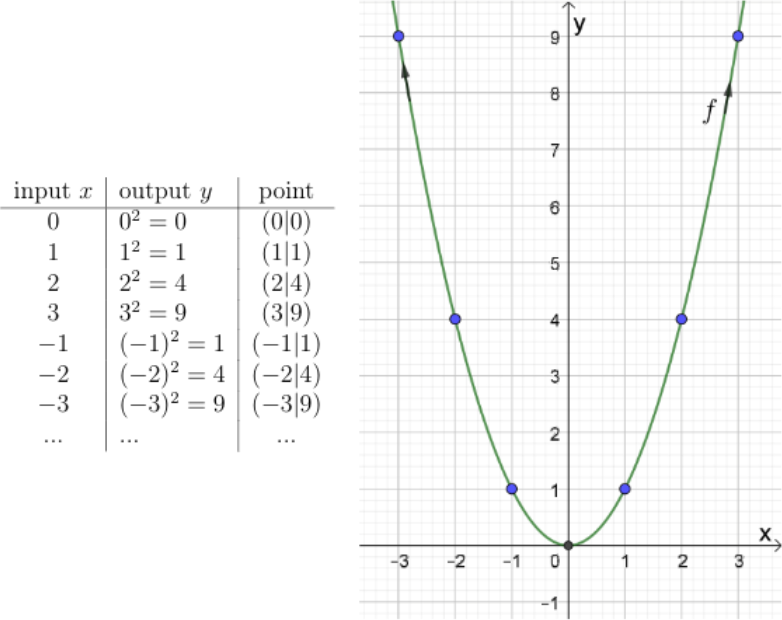
Sketch the graph of the function .
Solution
We have to determine a couple of input-output pairs, then indicate the points in a coordinate system, and use a smooth line to connect the dots. The more points you use, the more accurate the graph will be, of course.
Q1
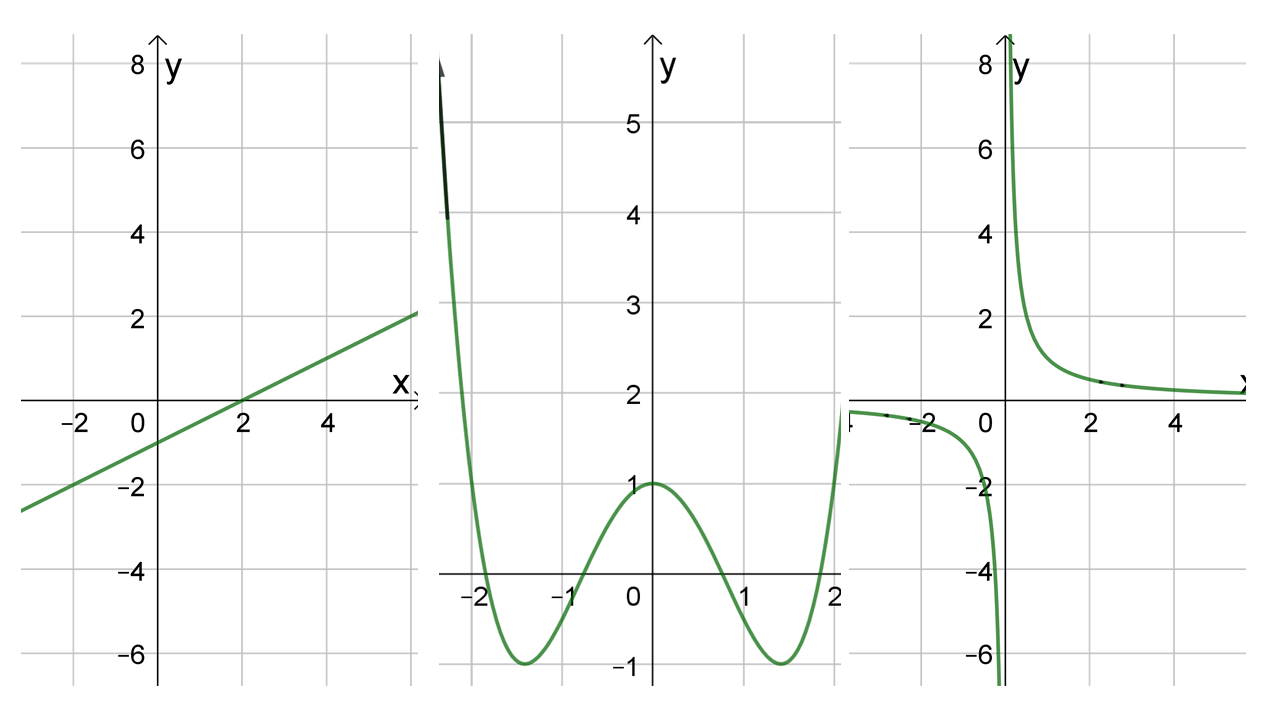
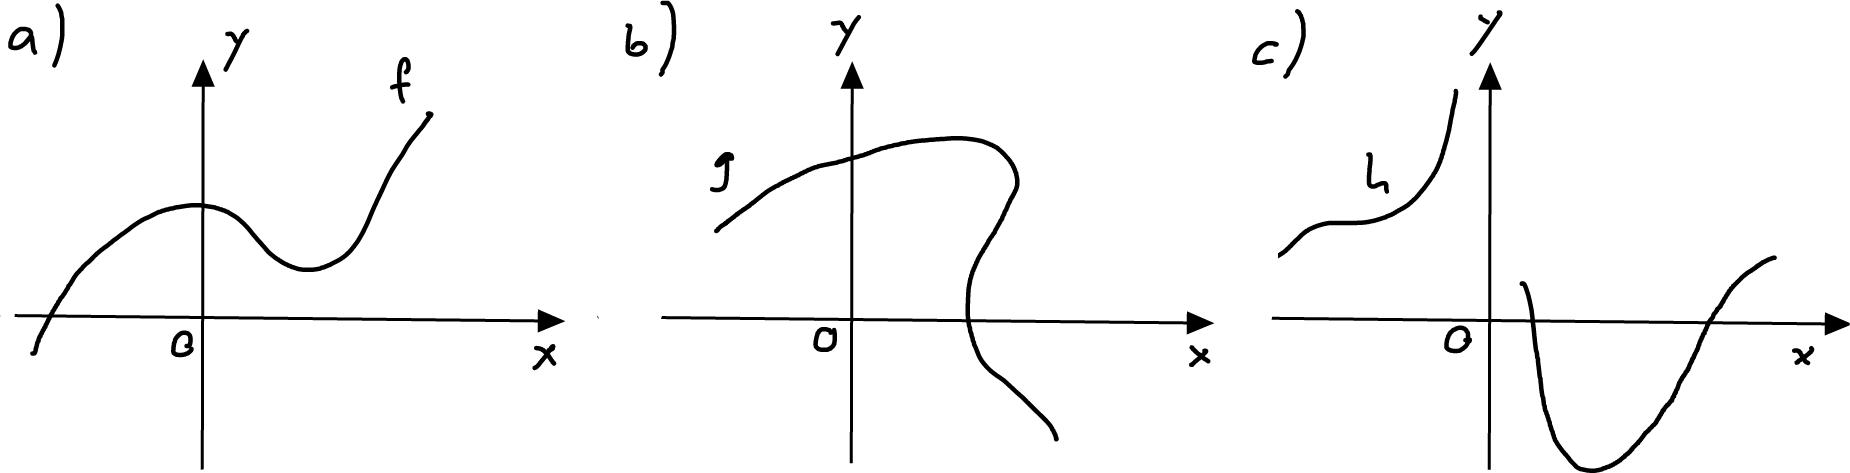
Assign each graph below to a function equation:
Q2
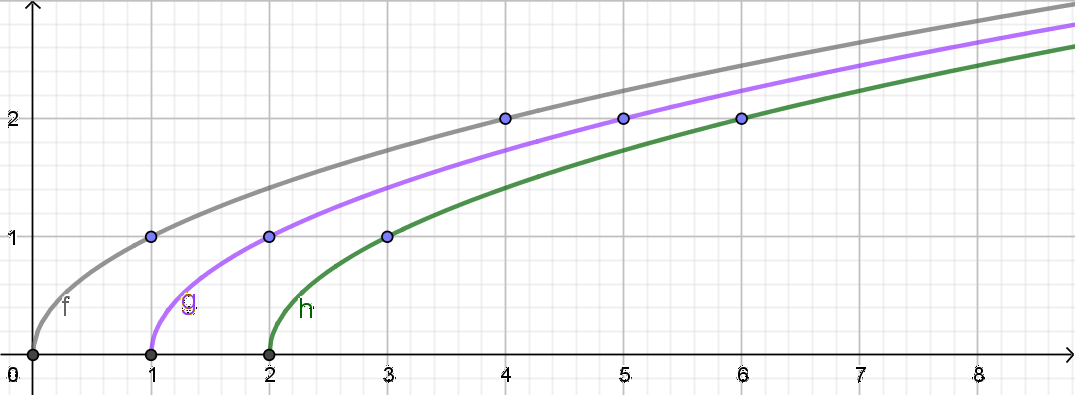
Draw the graph of the functions shown below. Find a geometrical operation to get from one graph to the next.
Q3
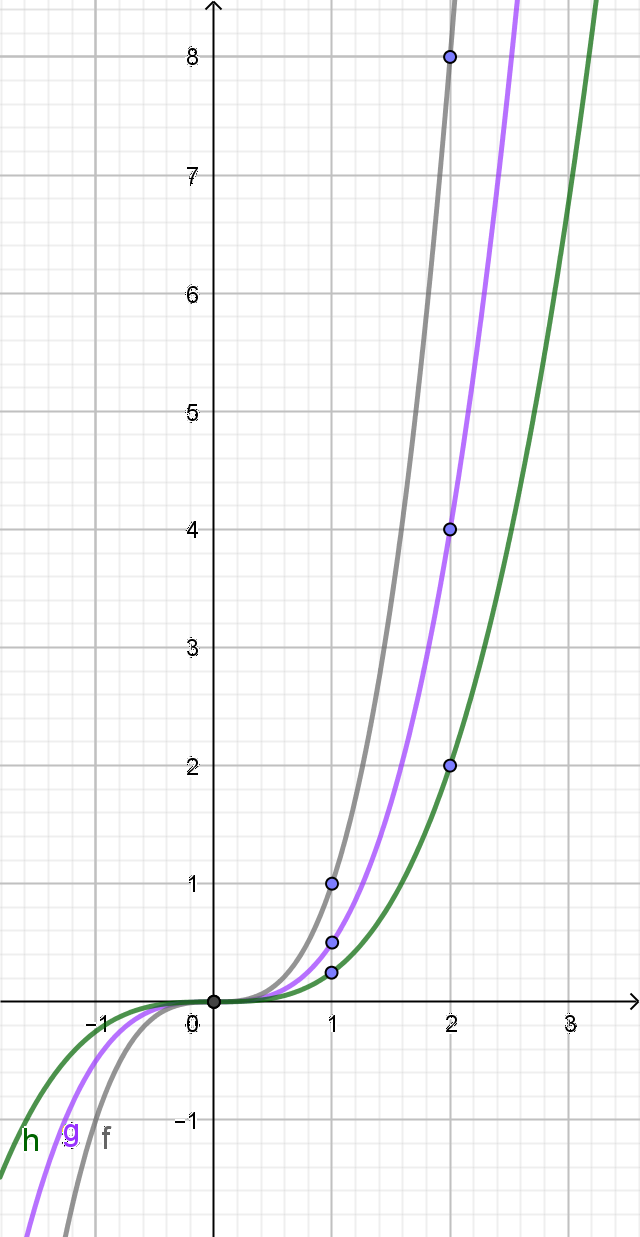
Draw the graph of the functions shown below. Find a geometrical operation to get from one graph to the next.
Q4
Consider the function . Find values and such that
- the points are on the graph of .
- the points are on the graph of .
Q5
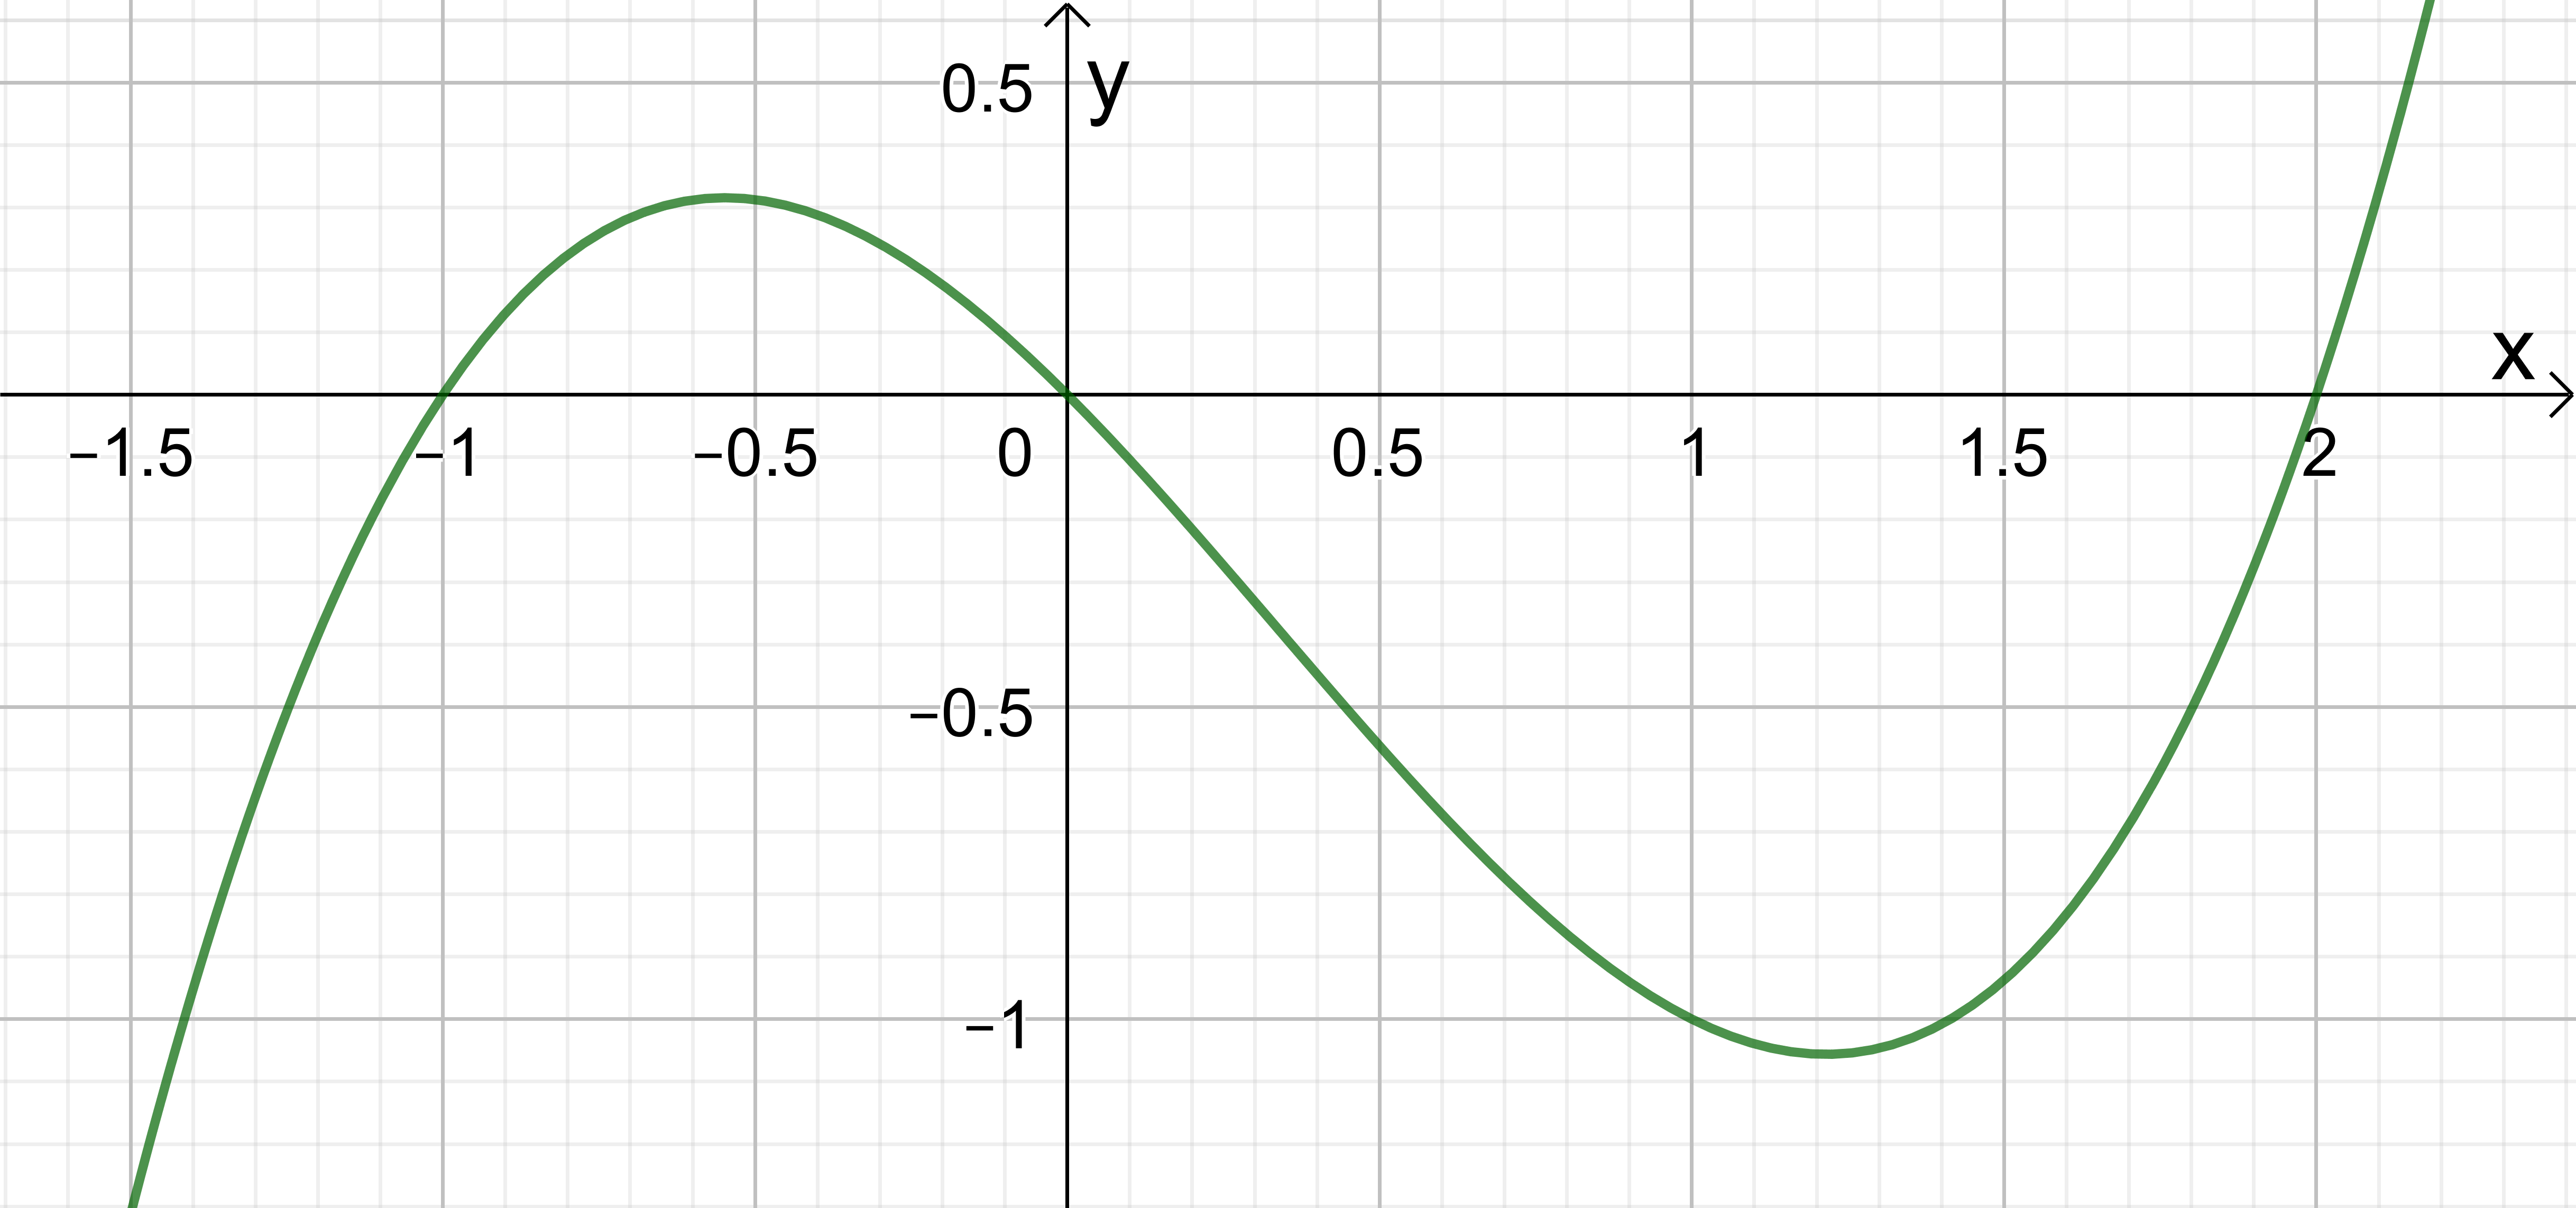
Consider some function . Based on its graph (shown below), estimate the following:
- , , and
- all input values with output value
- all input values with output value
- the domain and range of
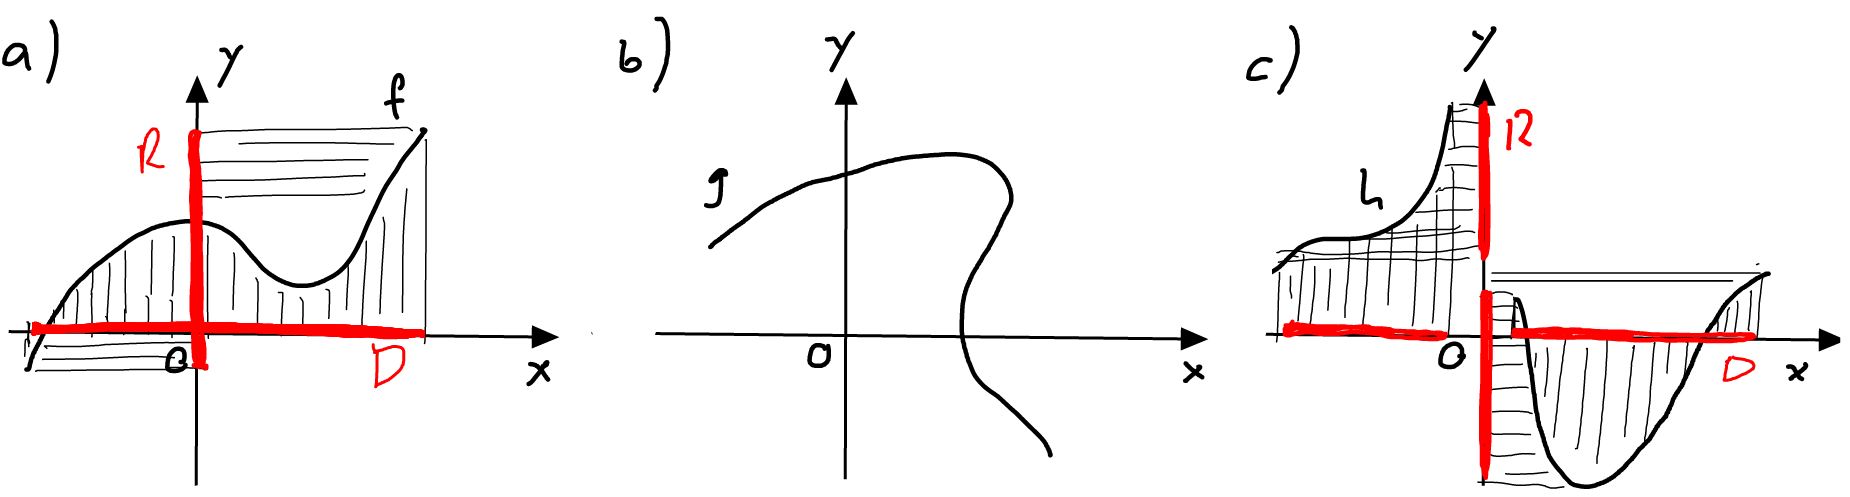
Q6
Which of these lines are graphs of some function ? Also, indicate the domain of each function on the -axis, and the range of each function on the -axis.
Solution
A1
Function is not defined for , so this must be the graph on the right side. Function is negative for , so this must be the graph to the left, and is position at , so it must be the graph in the middle.
Of course you could also sketch the graph of each function and then compare with the three figures.
A2
Shift to the right by unit.
A3
Compressed in -direction by the factor (or stretched by 0.5).
A4
- , thus .
- Find input with . Subtracting both sides by one, we get the following condition for :
Let's factor out an , we get
Thus, or . Thus, we have the two points and .
A5
- , , and
- The inputs , and have output
- The inputs , , and have output
- (assuming that the graph continuous upwards on the right, and downwards on the left)
A6
- and are functions, is not a function because some inputs () have more than two values ().
- The domain and range are indicated below.