Approximating the area beneath a curve
So how do we find the area of the region from to beneath the graph of a function ? Let's denote this area by
There is actually a generic method to find . The idea is to first find an approximation of the area, then we form better and better approximations until we see see toward which values these approximations converge. And this value has to be the area we are looking for. The analogues step in differential calculus was to find better and better approximations of the slope of the tangent using the secants. The slope of the tangent was then the number towards which the slope of the secants converged.
To keep things concrete, let's return to our example where we want to find the area from to beneath the graph of the function
Thus, is the area of the shaded region in the figure below. The figure also shows how we can find an approximation of this area. We simply cover the area by many
vertical bars of equal width and sum the areas of these bars. If we take bars, and the bar areas are denoted by , we thus have
We call the sum on the right the sum of bar areas. Let's now discuss how to find the bar areas .
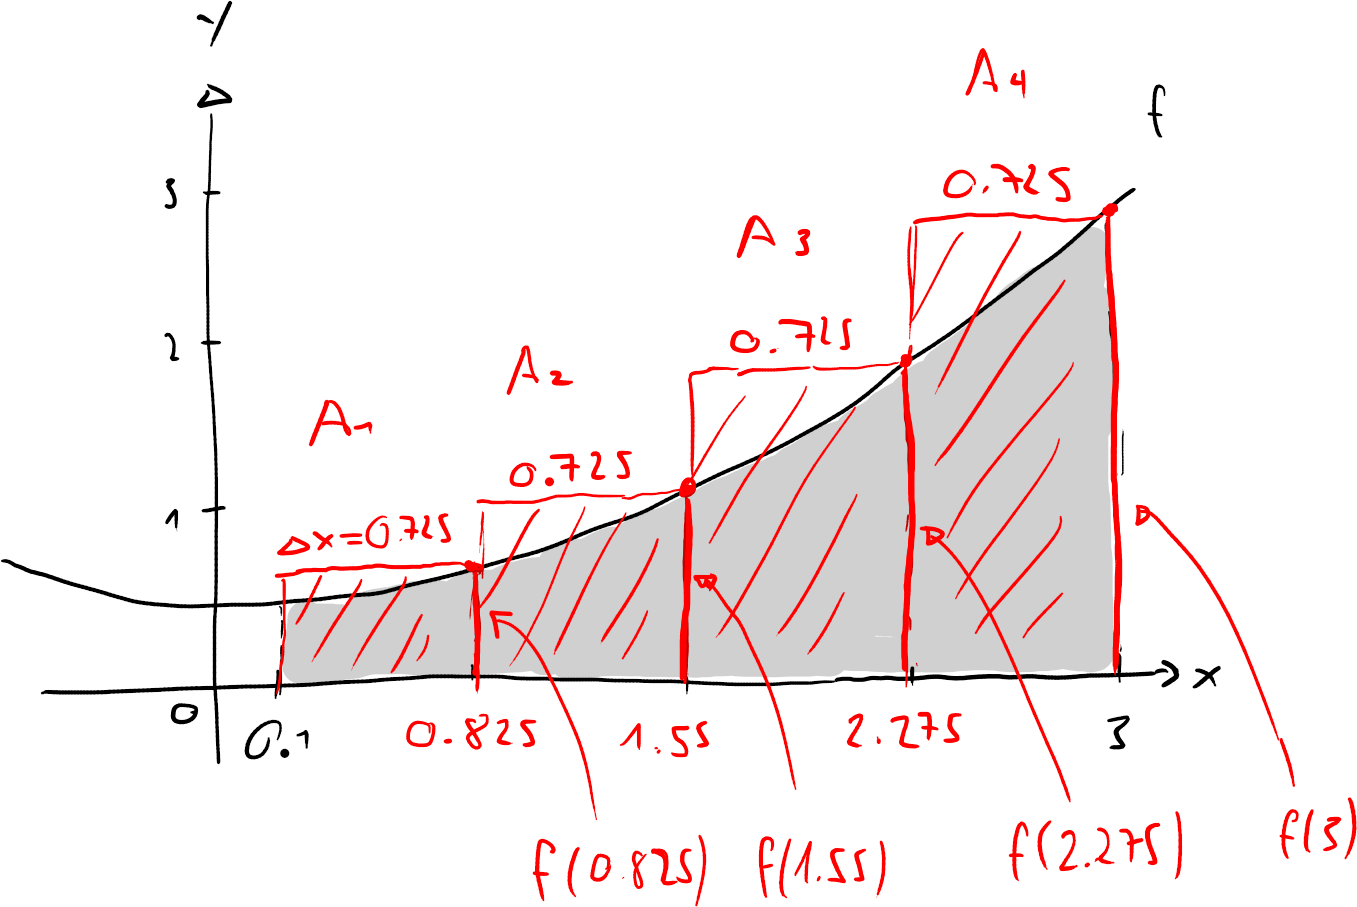
We first need to discuss how we actually constructed the bars, so that we can find their width and heights. Only then can we proceed to calculate the areas of these bars.
- We want each bar to have equal width, which we denote by
- The width of the bars is determined by the number of bars we choose to use. This is so because the bars have to start at and have to end at , which is a length of . Thus, we have to divide this length in equal parts, each of which forms the base of a bar. Thus, the width of each bar is given by the formula
In the example,the bars have to fit into the interval of length , and for the width of each bar it has to be true that
and thus we have
- The height of a bar is determine by its right border. This border has to end on the graph of . Note that we know where on the -axis each bar has its right border:
For the example, we have
We therefore can also calculate the height of each bar:
For the example, we have
- Thus we can determine the area of each bar:
For the example we have
- Finally, we can form the sum of the bar areas, which is an approximation of .
For the example, we have
-
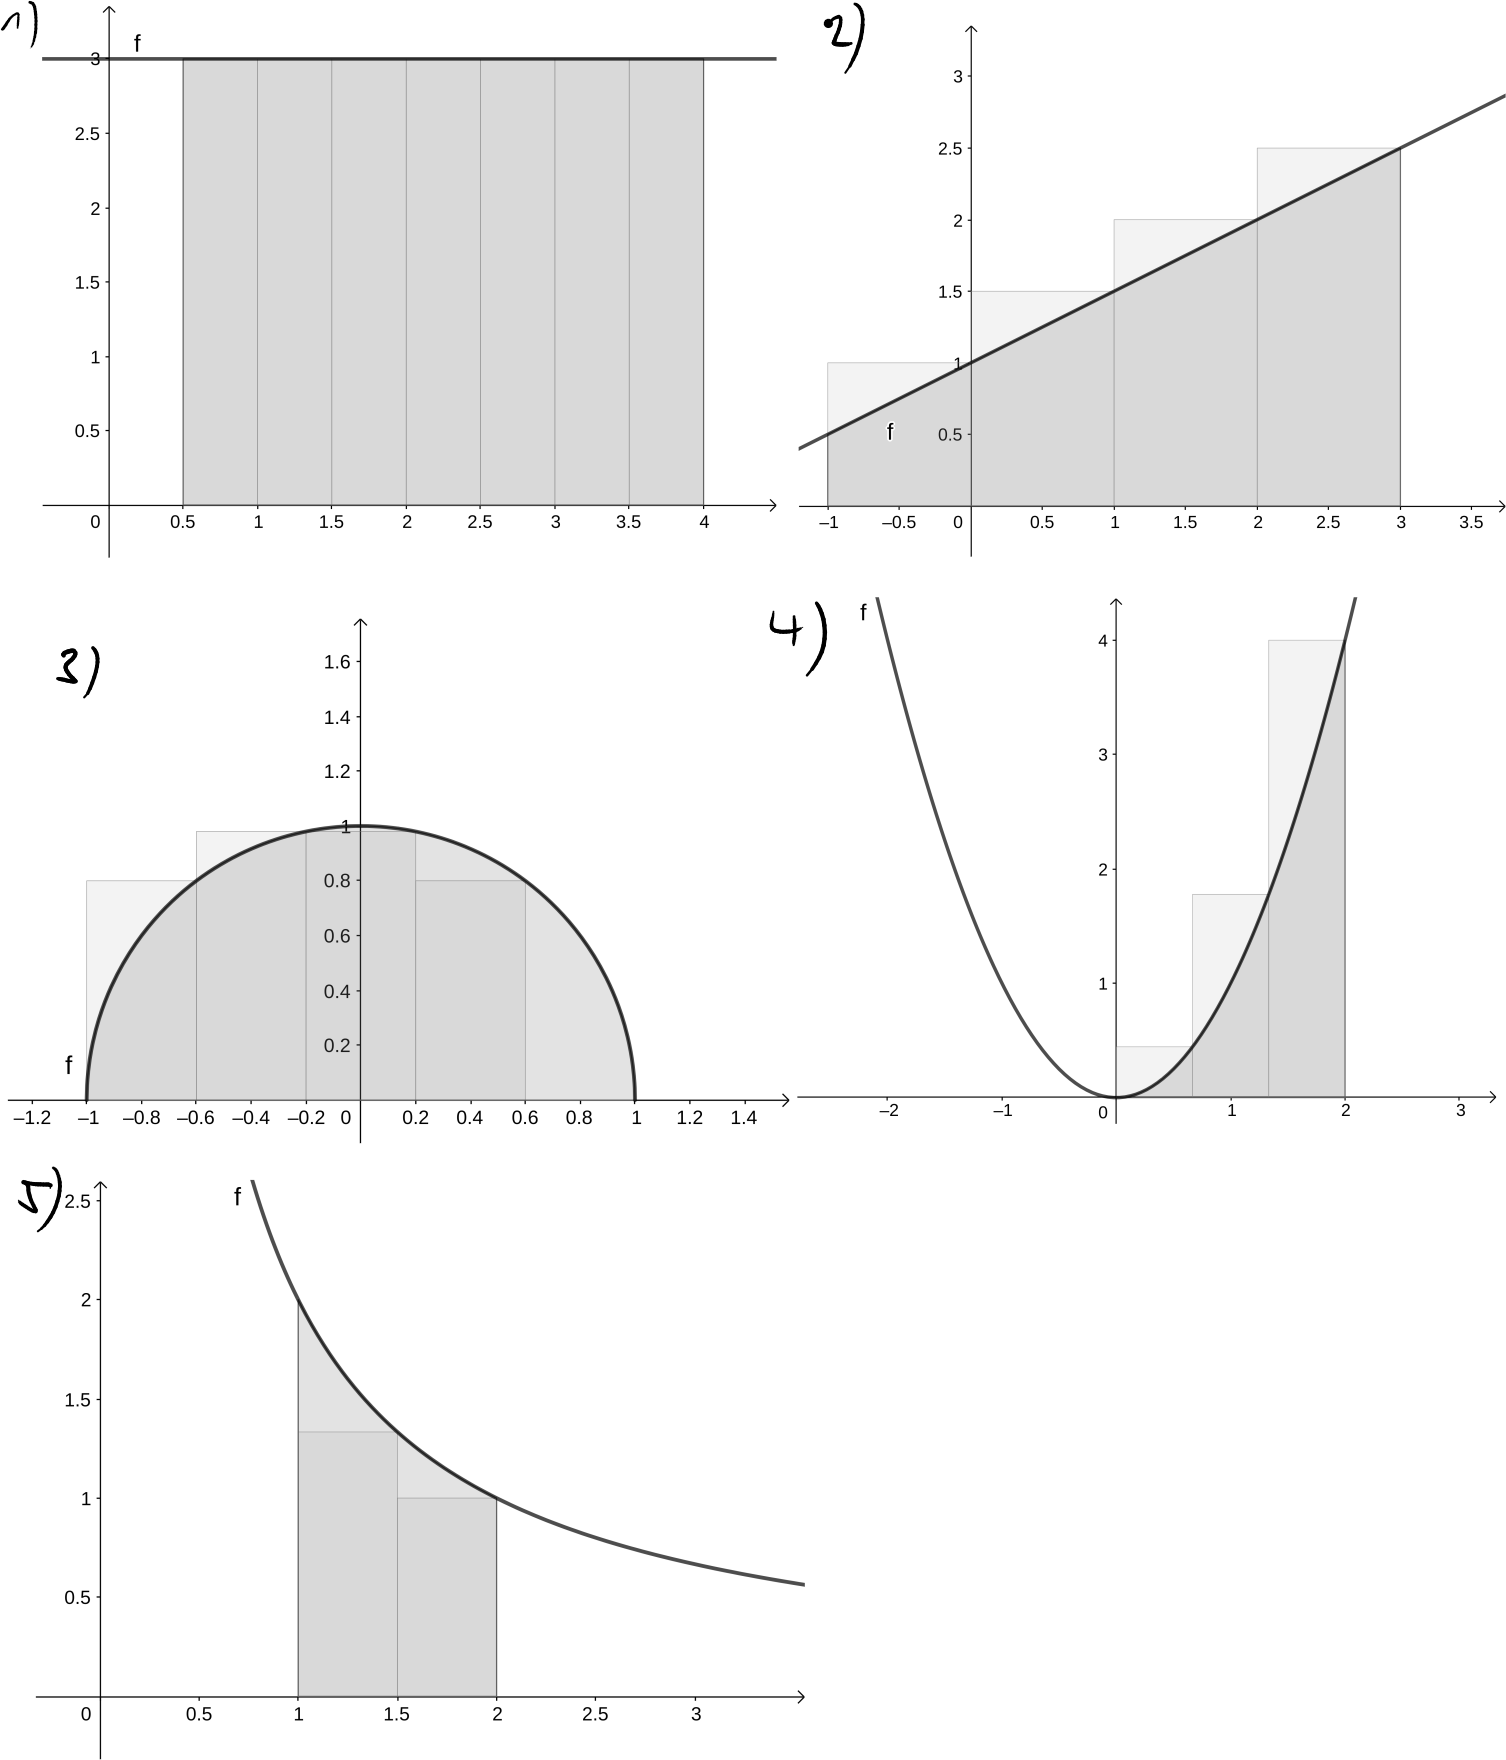
Use bars to approximate the area of the region from to under the graph of the function . Furthermore, where possible, calculate the exact area and compare with the approximation (see also section 27). Always create a figure and indicate the bars.
- for all (constant function), .
- .
- .
- , , ,
- , , ,
-
Use bars to approximate the area from to beneath the graph of the function . Hint: You need a sum formula we discussed in section 2 of integral calculus.
-
A car moves along a straight line. The instantaneous speed at time can be described by some function . We approximate the area from time to time beneath the graph of using bars. In this context, what is the meaning of the sum of bar areas?
Solution
- The graphs are shown below.
-
(see exercise in previous section)
-
(see exercise in previous section).
-
(see exercise in previous section).
-
(, but you do not know how to calculate this yet).
-
(, but you do not know how to calculate this yet)
- We have
Thus,
and therefore
Note that we have a formula for finding the first square numbers (see section 25):
For , we get
Thus, the sum of bars is
The exact area, by the way, is , but you do not know how to calculate this presently.
- Each bar area is the product of a speed and a time , thus each bar area is the distance travelled by the car during the time (at least an approximation of it).
The sum of bars between the times and is therefore the approximate distance travelled in the time interval from to .