Linear functions and their graphs
A function of the form
is called a linear function. The letters and are fixed numbers and are called coefficients. Here are some examples
- ()
- ()
- ()
- ()
- ()
- ()
- ()
Linear functions are quite simple. The input is multiplied by the number , and then the number is added. If the input is squared, or the root of the input is taken, or it is divided by the input then these functions are not linear. So, all these functions are not linear:
But sometimes we can simplify the function equation and get a linear function:
- because with the third binomial formula we have
Finding the -intercepts, -intercepts and intersection points of linear functions is straight forward.
Consider the functions and . Determine the - and - intercepts of , and the point of intersection between the graphs of and .
Solution
-intercept: -intercept: Find with
intersection point: Find with
To find the -coordinate, we can use or . We take :
Thus, the point of intersection has the coordinates .
The graph of a linear function is a straight line
It is also straight forward to find the graph of a linear function using the table of values. It is always a straight line:
Use a table of values to determine the graph of the functions and . Draw the graphs into the same coordinate system.
Solution
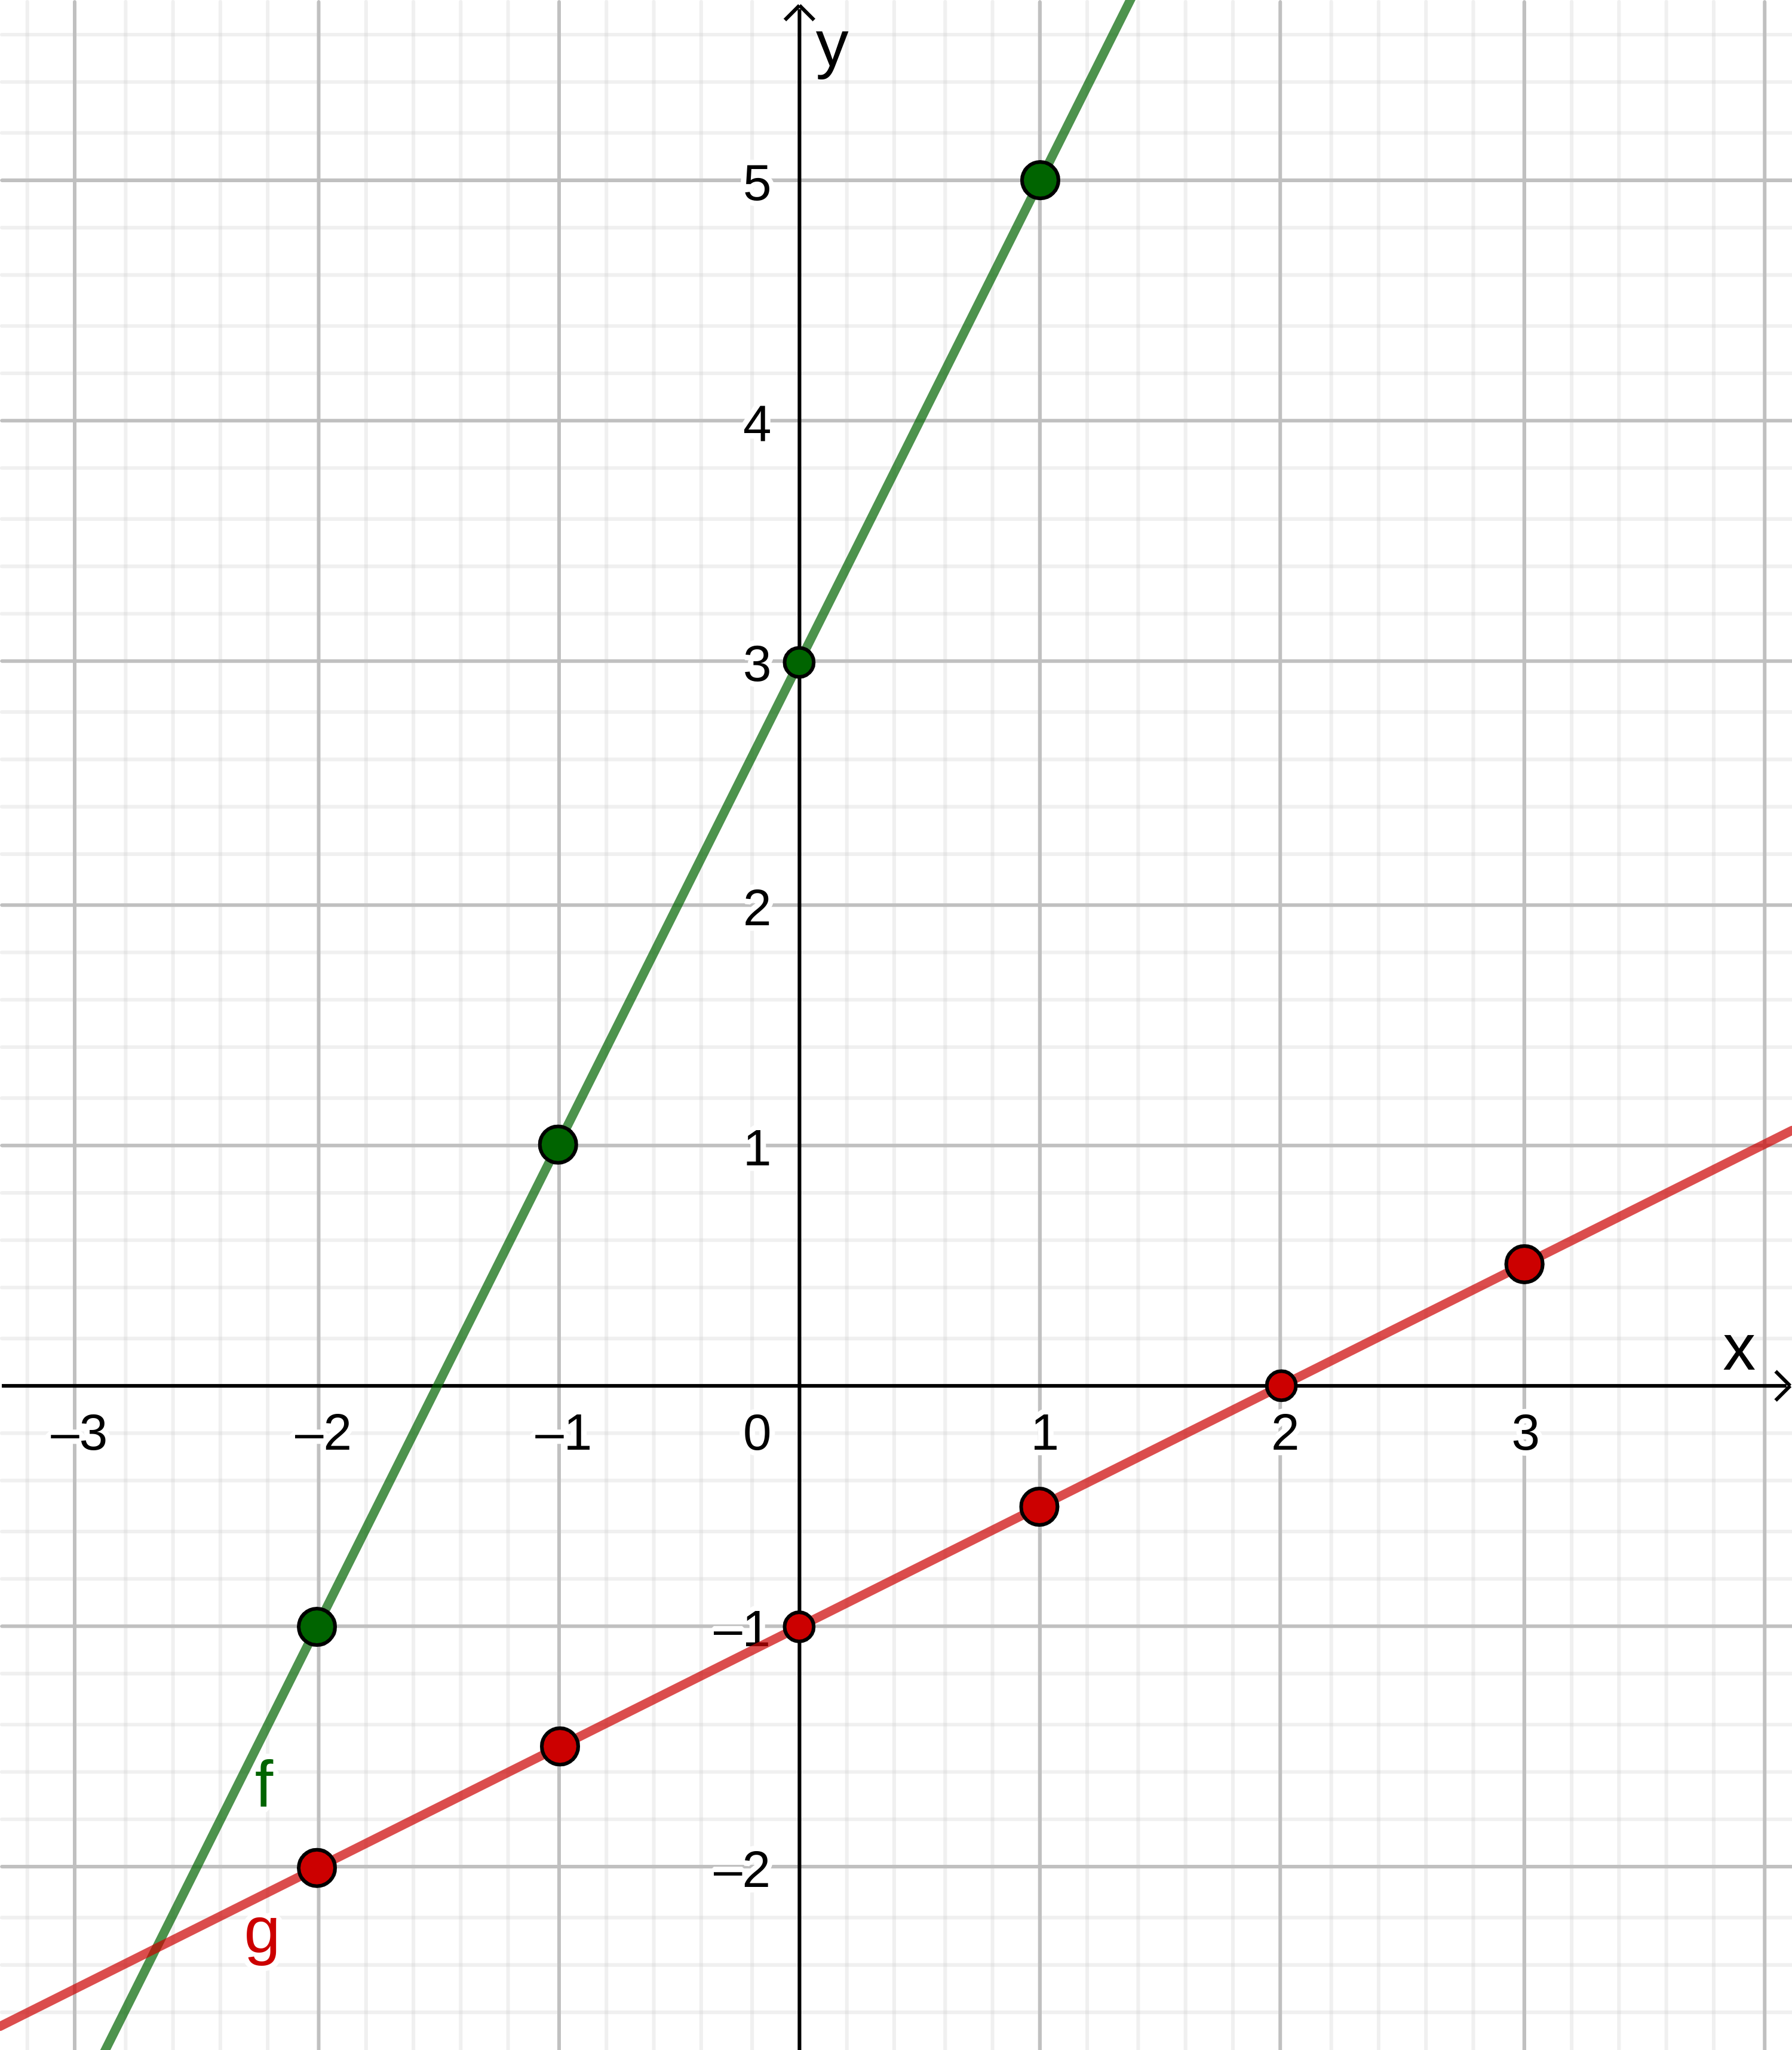
In the exercise above we have seen that the graph was a straight line. Indeed, this is true for every linear function:
The graph of a linear function is a straight line.
Now, it is clear that the straight line will look different depending on the exact coefficients and . But how exactly? This is explained in the next section.