Probability
A. Random experiments, probability of outcomes and events, Laplace experiments
Consider a random experiment "a die is rolled once"
- Explain, what is a random experiment?
- Explain, what is the sample space of an experiment?
- Explain, what is an outcome and what is an event of an experiment?
- What does it it mean, that an event "occurs"? Explain with the help of the outcomes in this event.
- How do you determine experimentally the probability for an outcome to occur?
- How do we determine experimentally the probability for an event to occur?
- Express the probability of an event with the outcome probabilities of the experiment.
- Determine and and give an intuitive explanation.
- What number do you get if you add all outcome probabilities of a random experiment?
- What is a Laplace experiment?
- Why does the probability of an outcome in a Laplace experiment only depend on the number of possible outcomes? And what is this probability?
- For a Laplace experiment we can determine the probability of an event with the formula Explain why this formula is correct.
- A fair die is rolled twice. Determine the probability for each outcome, and for the event "the sum of the two numbers is even".
Show
Solutions A
- A random experiment has several possible outcomes. Each time you perform the experiment, exactly one of these outcomes occurs, but it is not possible to predict with 100% certainty which one it will be.
- The sample space is the set of all possible outcomes, .
- An outcome is any element of this set, e.g. ("die shows a 1"). An event is any subset of the sample space, e.g. ("die shows an even number"). The sample space is also an event.
- An event occurs if one of the outcomes in occurs. For example, the event ="die shows even number" occurs if one of the outcomes , or occurs.
- The probability of an outcome is the percentage of times for the outcome to occur in the long-run (that is, after many, many repetitions of the experiment). For example, if you roll a die times, and the occurs times, then the probability for "1" is approximately or . The more often you repeat the experiment (the bigger ), the more accurate is the estimate of the probability.
- Similar to an outcome, the probability of an event is percentage of times for the event to occur in the long run (that is, after many, many repetitions of the experiment). For example, repeating the experiment "rolling a die once" times, and the event ="even number" occurs times, then the probability of this event is approximately or . The more often we repeat the experiment, the better is the approximation to the probability.
- As occurs if either , , or occurs, we simply have to add the percentages of times the , the , or the occurs, that is, we have . More generally, for an event , we have .
- is the probability of the event "any outcome of the experiment occurs". And because an outcome always occurs, it is . is also called the sure event. is the probability of the event "no outcome occurs". It follows . The event is also called the impossible event.
- We have seen that and (that's true for any event), thus we get .
- In a Laplace experiment, all outcomes must have the same probability : . In other words, the experiment is "fair".
- Because all outcomes have the same probability, and the sum of all probabilities has to be , and we see that the outcome probability is inversely related to the number of outcomes of the experiment.
- Assume there are possible outcomes, that is, , and that contains of these outcomes, , and thus . As it is a Laplace experiment, all outcome probabilities are the same, . It follows
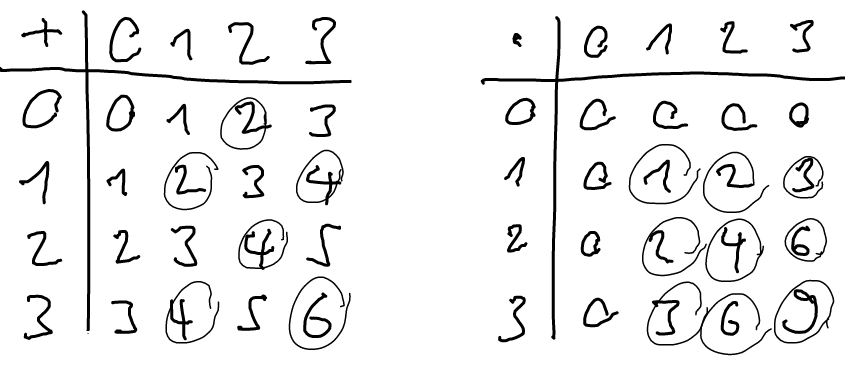
- The table shows all the possible sums of the two numbers: Each outcome such as "43" (meaning roll 1 is a "4" and roll 2 is a "3", so the sum is 7) has the same probability to occur. Thus, the event =" sum is even" is and therefore has probability
B. Conditional probability, independence, Venn-Diagrams, probability trees
- For two events and , what is the conditional probability ? Explain.
- Consider two events and of a random experiment. Represent the events in a Venn-Diagram and show the following:
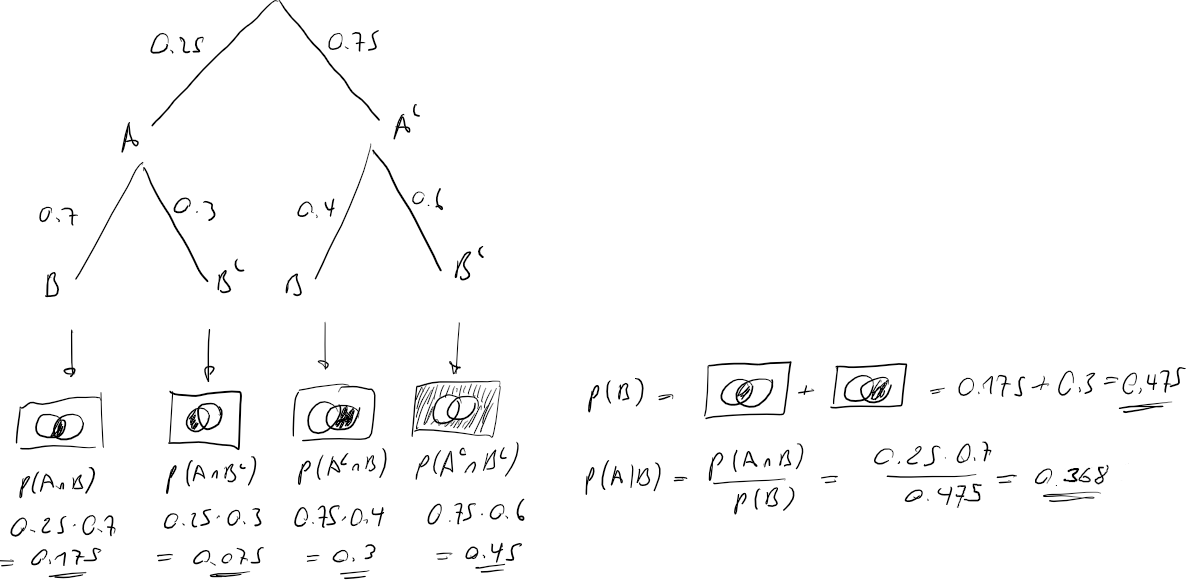
- Consider two events and with , , and Draw the probability tree (starting with ) and indicate each branch probability. Use these branch probabilities to calculate , , , , , and .
- Is it always true that ? If not, when is it true. Also, what is the general formula for ?
- The two events and are mutually exclusive. What does this mean? And are the two events independent?
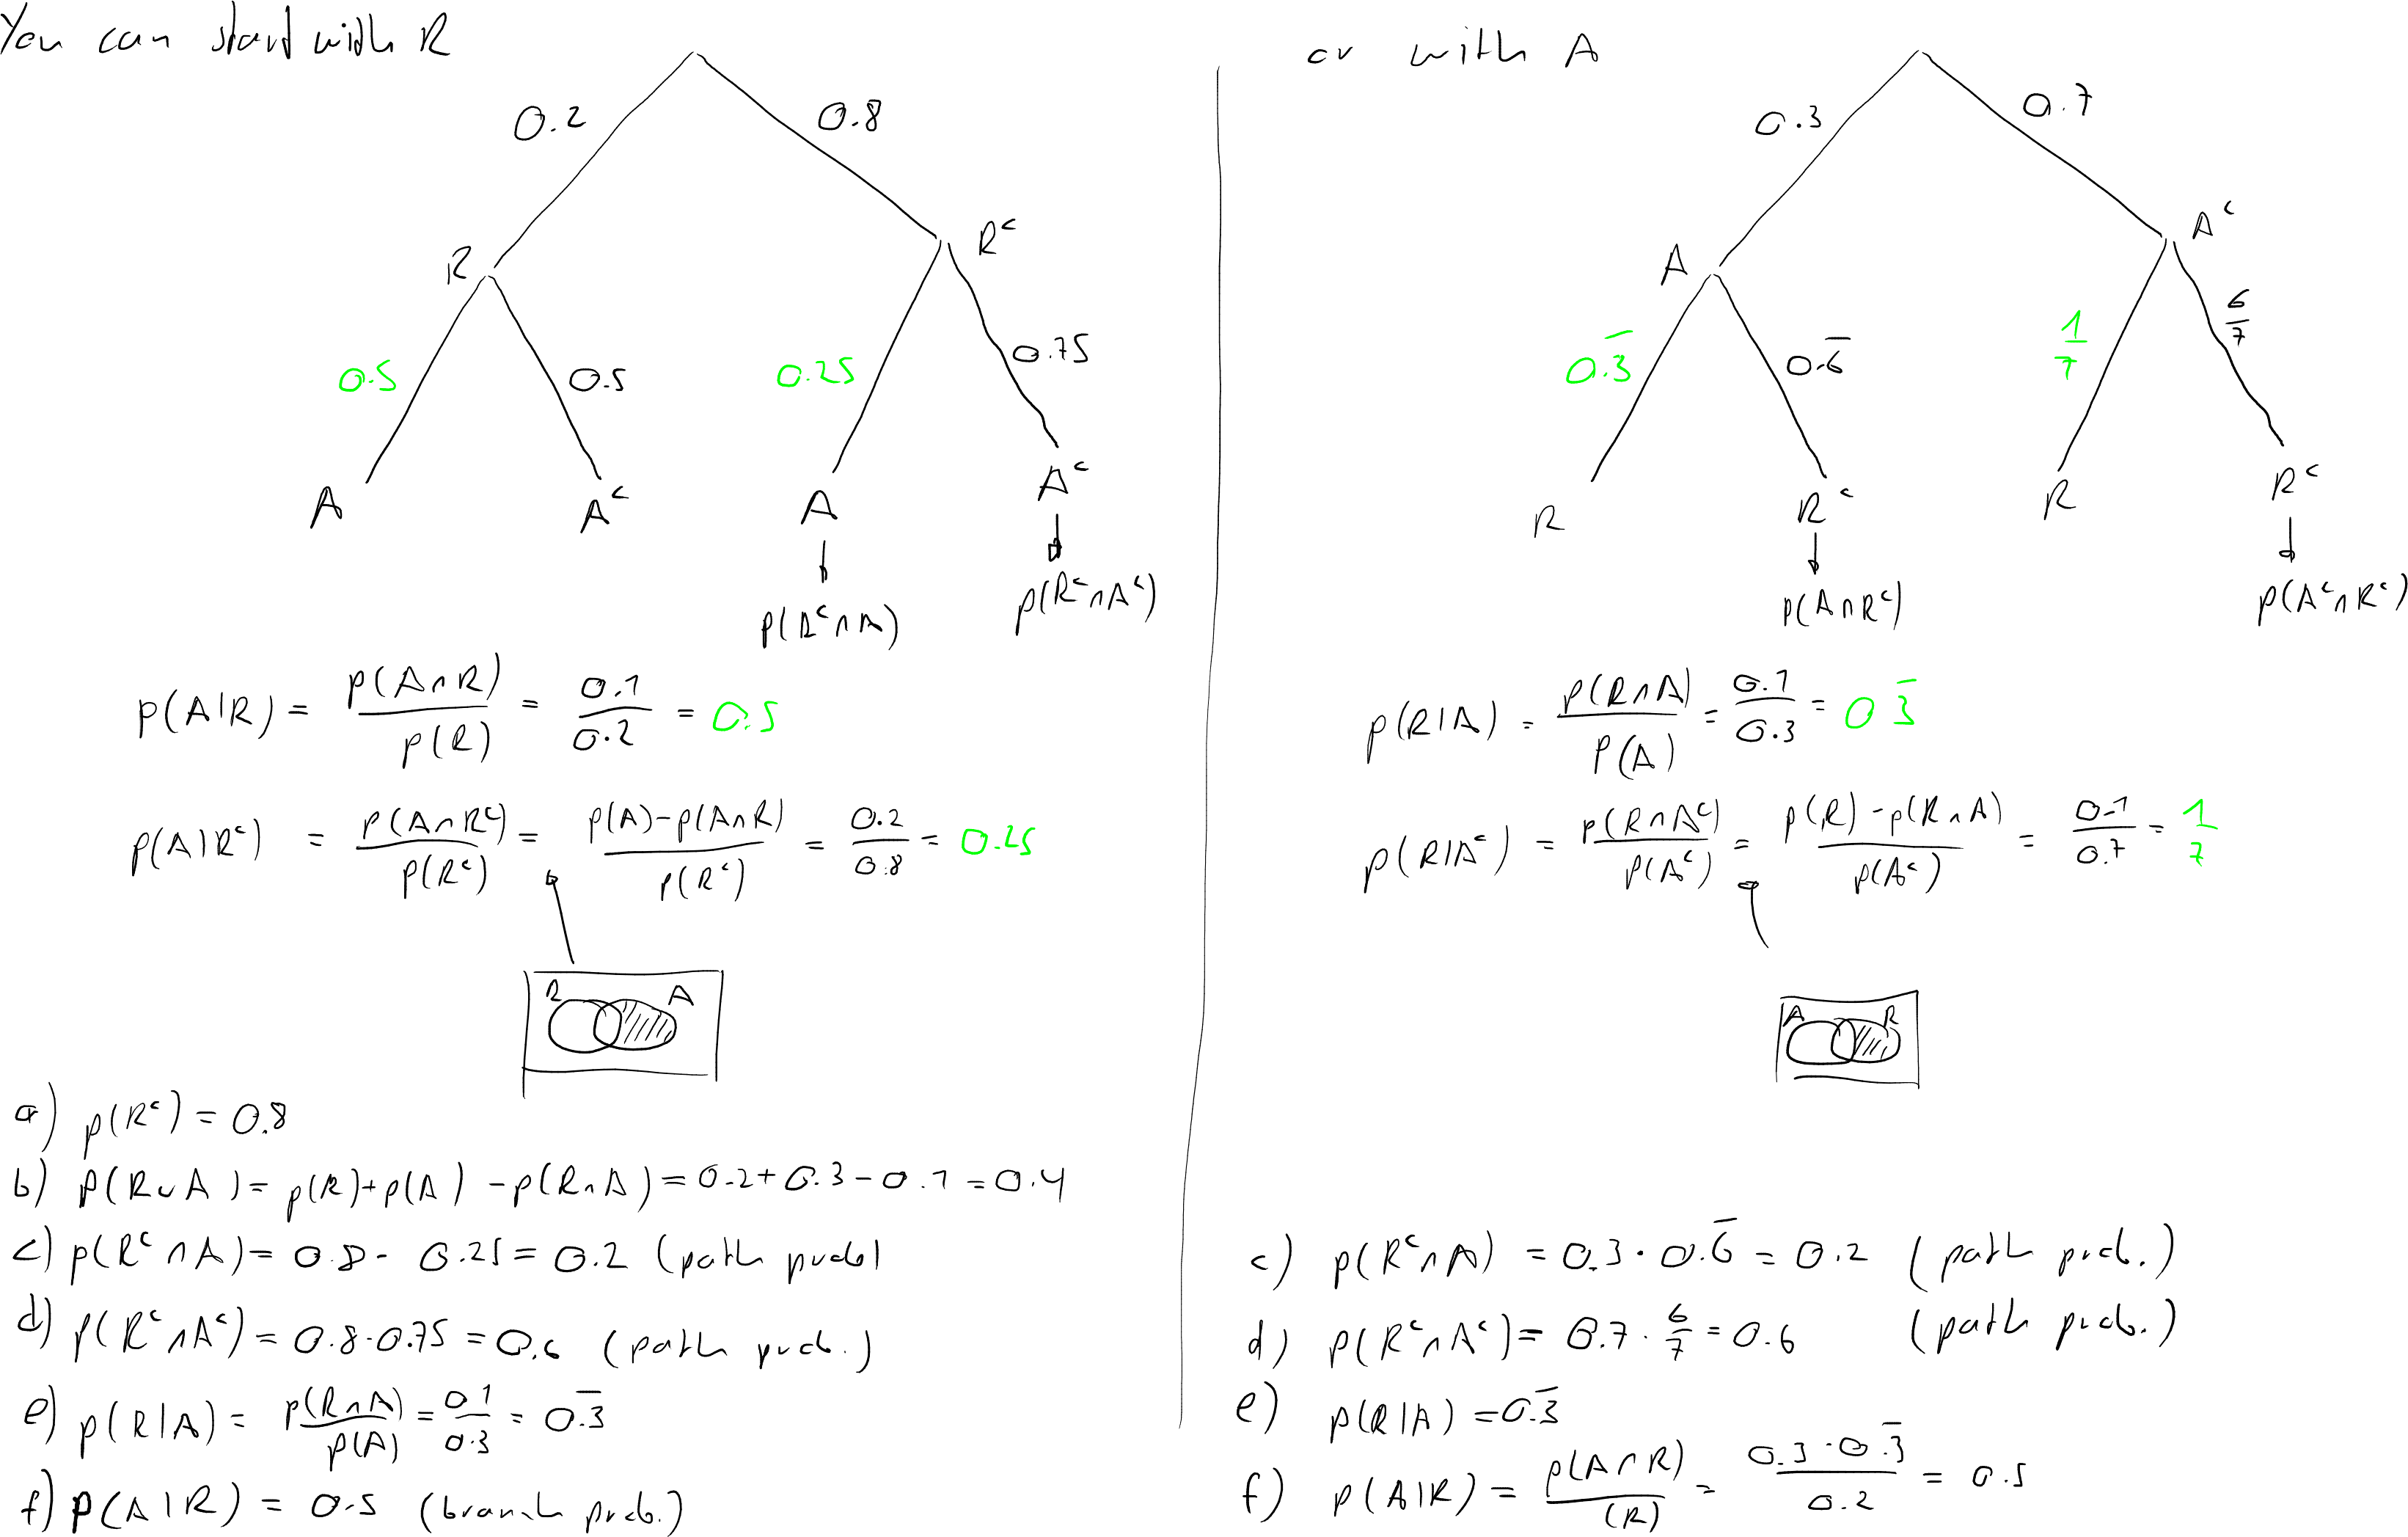
- is the event "it rains" today, and is the event "there are accidents" today. Assume now that and , and . Draw the probability tree and indicate the probabilities. With the help of the tree determine the probabilities for the events
- it does not rain.
- it rains or there are accidents.
- it does not rain and there are accidents.
- it does not rain and there are no accidents.
- it rains given that there are accidents.
- there are accidents given that it rains.
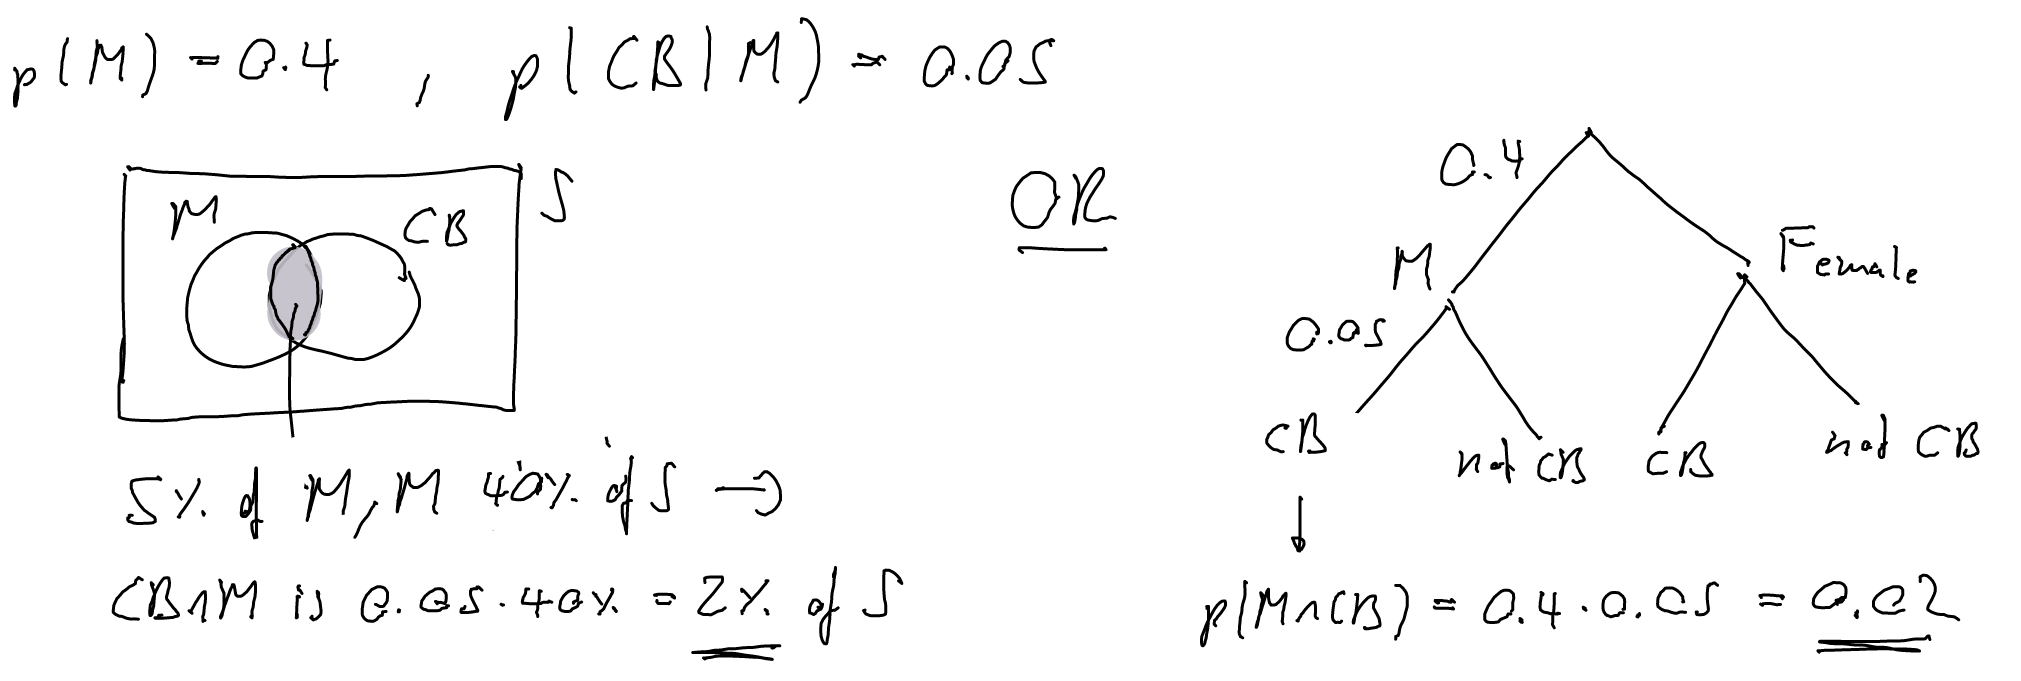
- A study determines that on an island, of the inhabitants are male, and of these, are color blind. If you randomly select a person from the island, what is the probability that the person is a color blind male? Draw the corresponding probability tree.
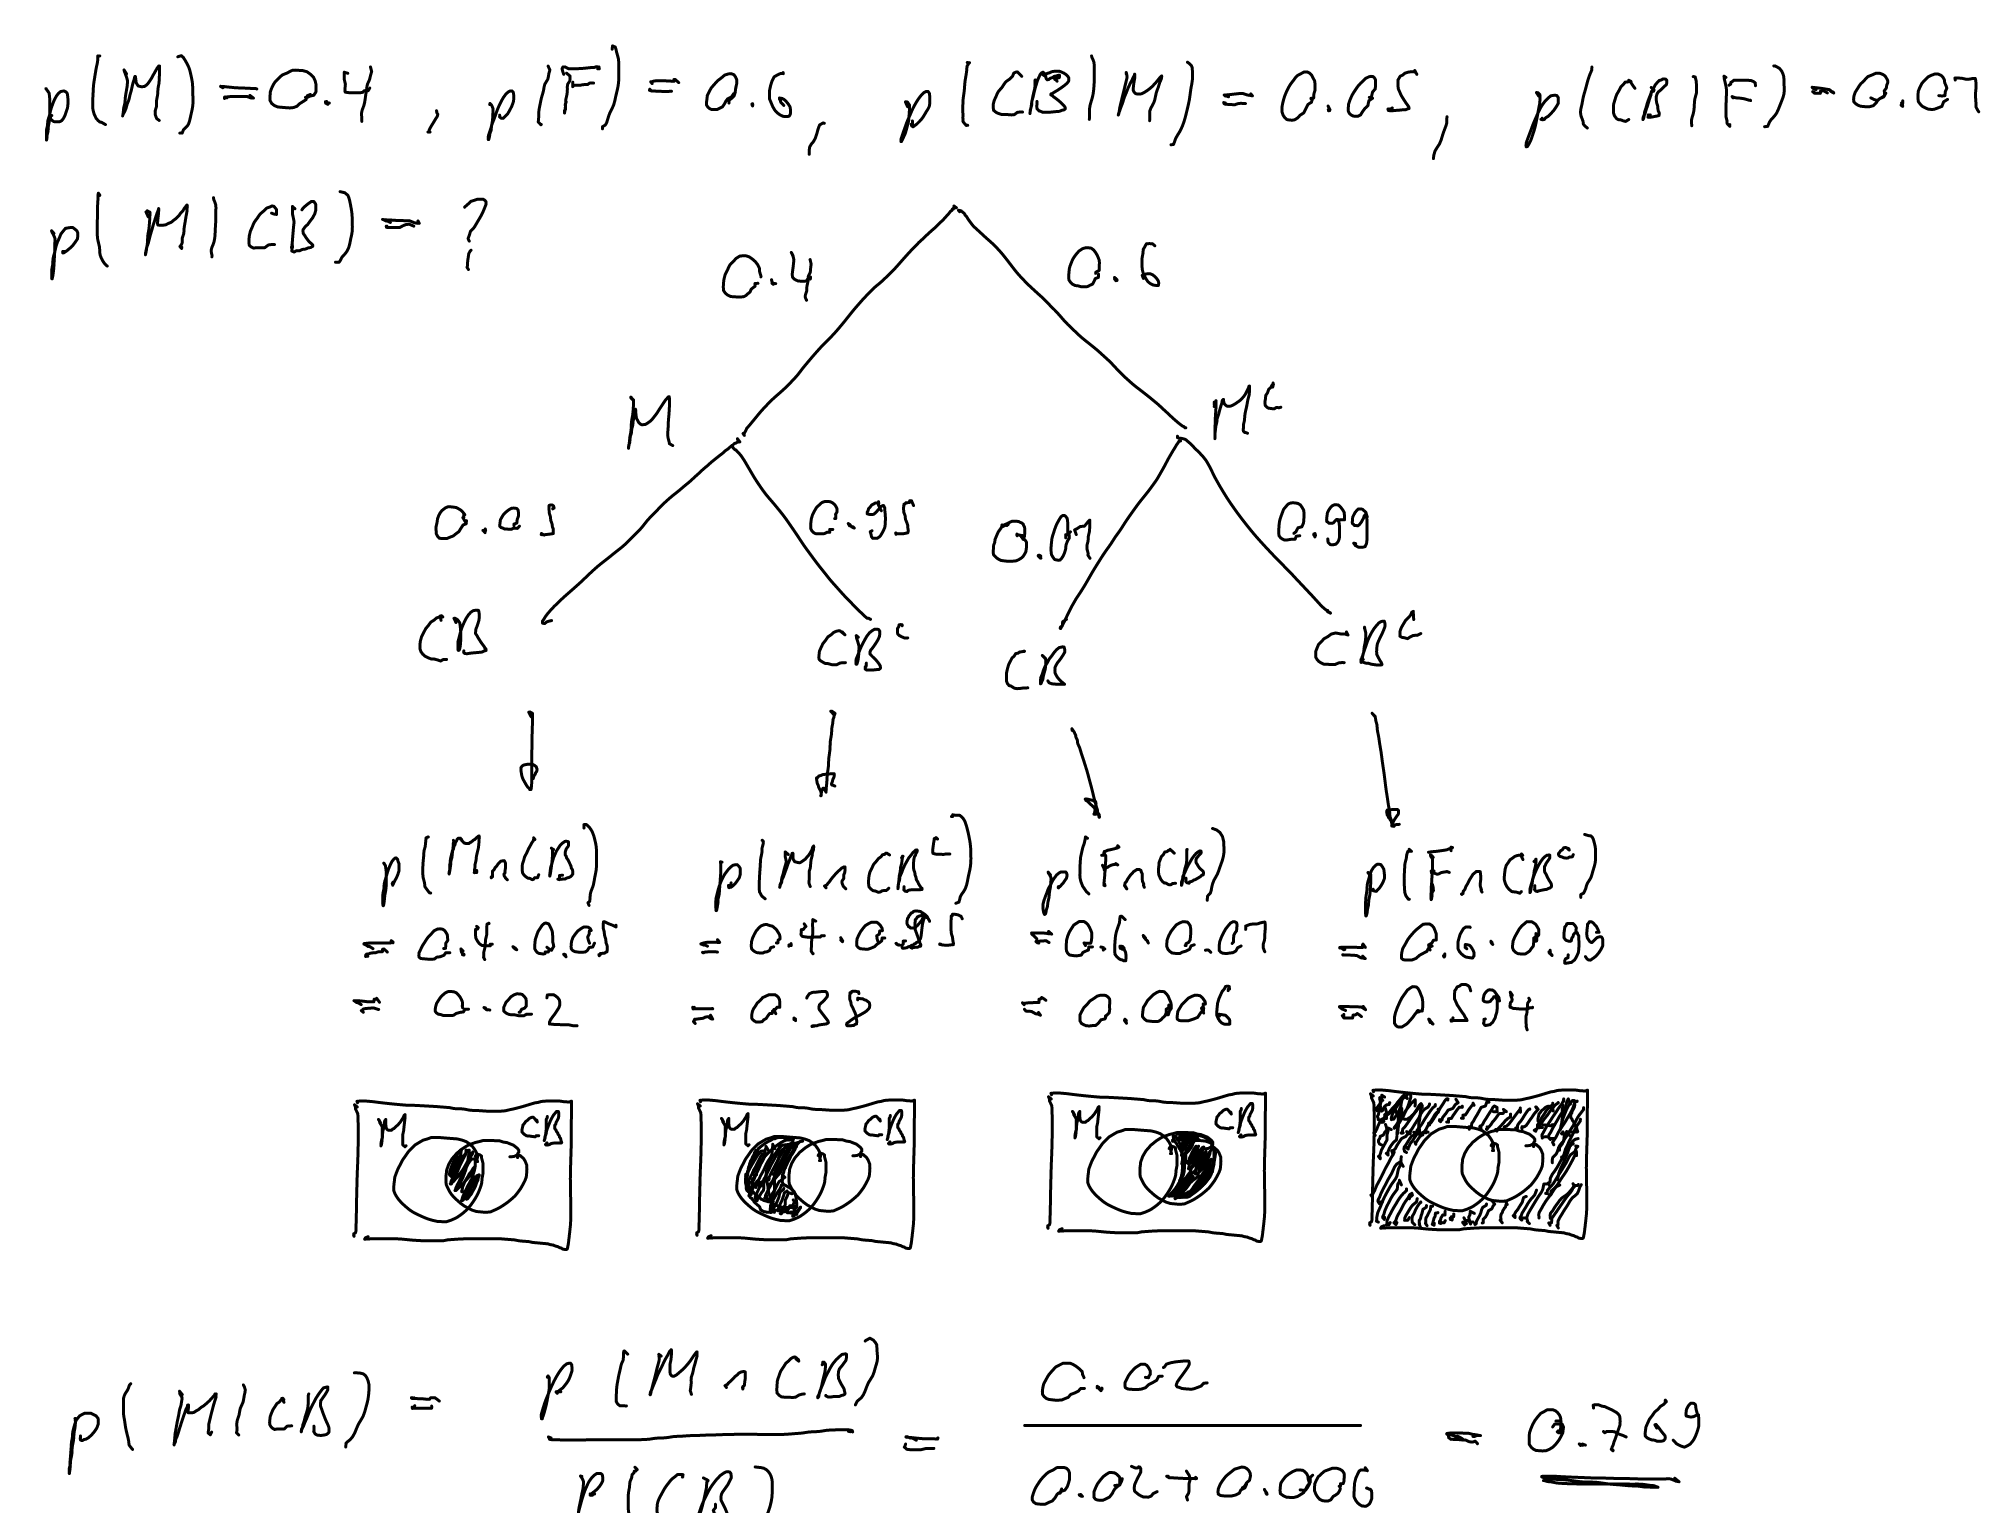
- A study determines that on an island, of the inhabitants are male, and are female. of the male inhabitants are color blind, for the females it is just . If you randomly select from the color blind inhabitants, what is the probability that the person is male?
- A box contains four balls labelled from to . Two balls are selected at random and with replacement. Are the events "sum is even" and "product is " independent? ( is an even number).
Show
Solutions B
- is called the conditional probability of given . It has several interpretations, which are illustrated with the following example. Given a forest, and the events = "a branch in the forest snaps" and = "a person sits on the tree". Here are three interpretations of :
- is the probability that a branch snaps knowing that a person sits on the tree. If, for example, then will normally be different, e.g. . (Only if and are independent is ).
- The sample space contains all the trees in the forest, and is the percentage of all these trees with a snapped branch. is the percentage of trees with a snapped tree relative to the reduced sample space , that is, is the percentage of trees with a snapped tree relative to all the trees with a person sitting on it.
- Percentage of a percentage. Say of the trees in the forest are occupied by people (event ), and of these, have a snapped tree. So we have , and . From the last example we see that the percentage of trees in the forest with a snapped tree and a person sitting on it is of , which is (). In other words, we have the formula or
-
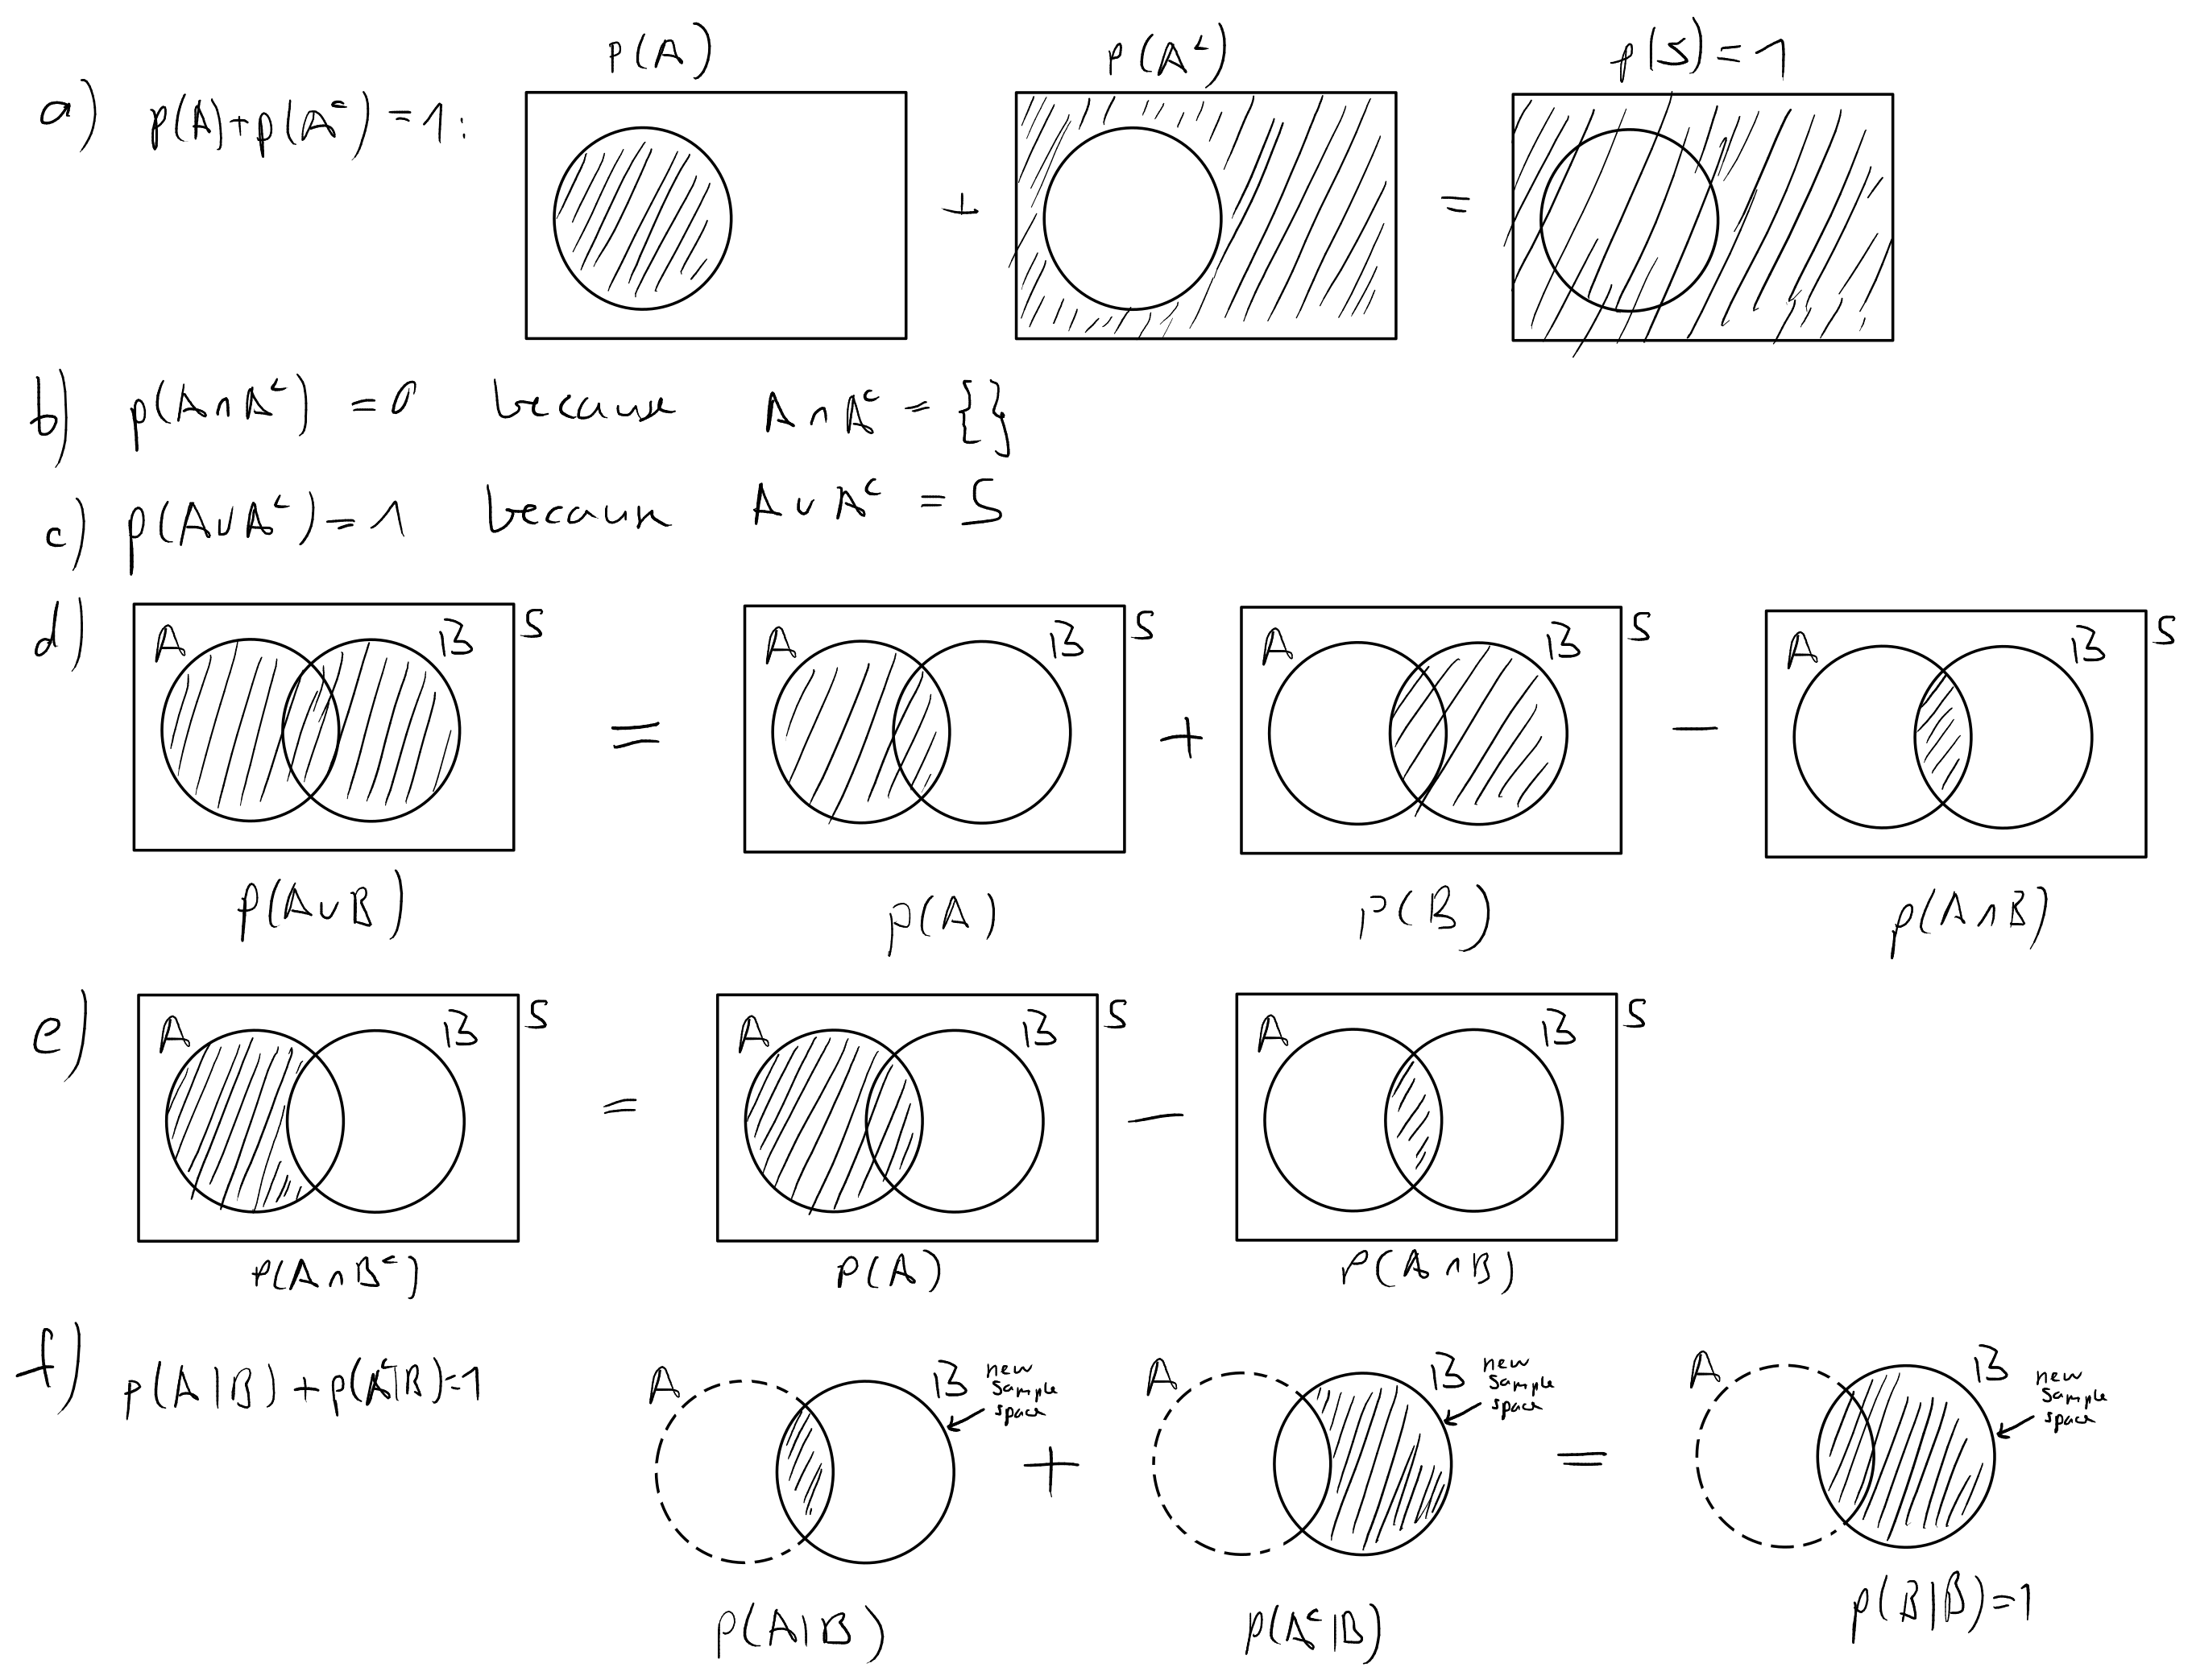
-
- No, is only correct if and are independent. Actually, this equation is one definition of independence. Another one is that (which means that the occurrence of event has no influence on the probability of event , which makes actually sense if and are independent. Or another one is that . Also, intuitively it should be clear that if and are independent, so are the two events and , and , and and .
- and are mutually exclusive if the can not occur together in the same experiment. This is only possible if they have no outcome in common, such , and thus . It also follows that and are not independent (they are dependent), because once I know that has occurred, I know that cannot occur, so clearly (with the exception of ).
-
- You can use the Venn-Diagram or the tree. I recommend the tree ... . ="male, ="female", ="color blind".
- ="male, ="female", ="color blind".
- ="sum is even", ="product >0". See figure below.
Method 1: check if .
And we see that and are dependent, because .
Method 2: check if (or ).
And again we see that the events are depend, as
C. Combinatorics, independent and dependent repetitions, binomial experiments
- When do you need
- ( factorial)
- the MISSISSIPPI-problem
- the binomial coefficient
- Calculate and also determine intuitively
- A box contains balls. Three balls have a weight of , five balls have a weight of and the rest of the balls have a weight of .
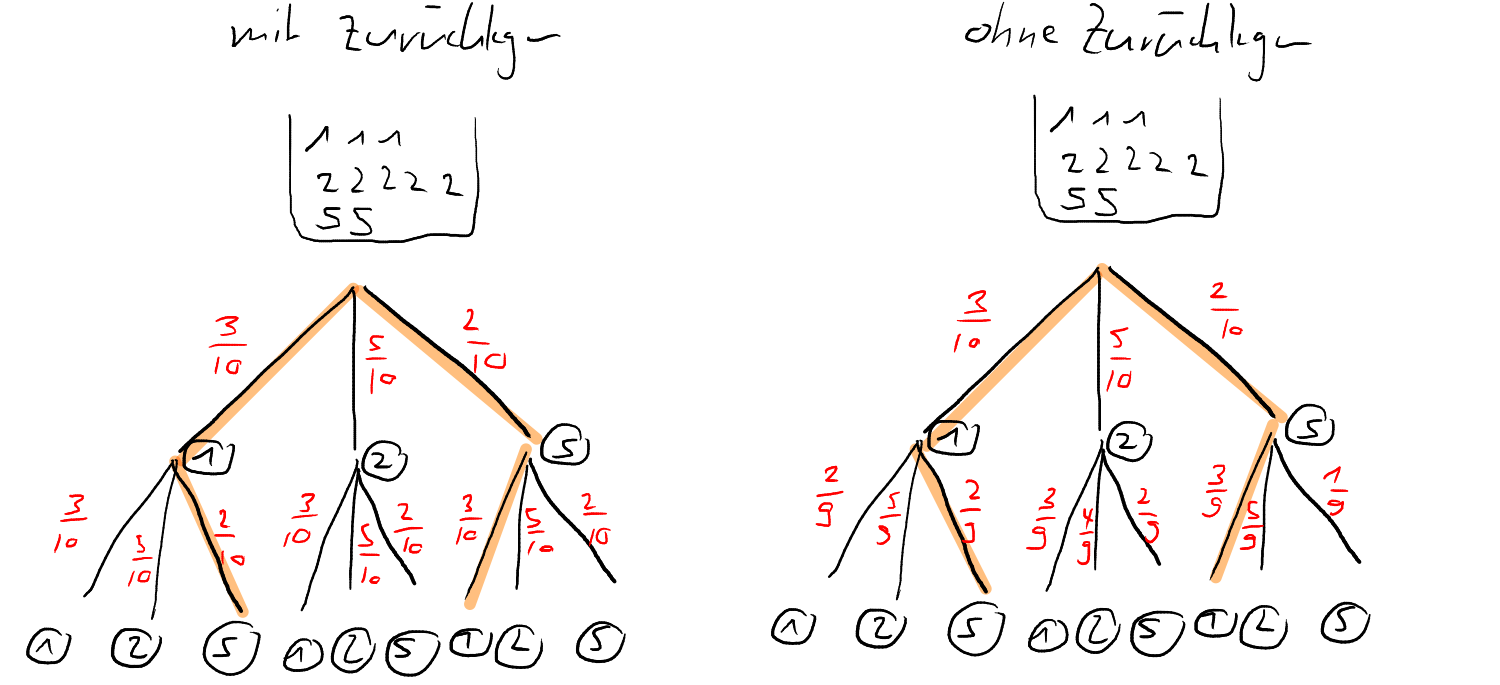
- Two balls are drawn one after the other, with replacement. Represent the experiment with a probability tree and indicate the probabilities. Also draw the probability tree for the case in which the drawn ball is not replaced.
- For both cases (with or without replacement), determine the probability that the two balls drawn will have a total weight of .
- SKIP! Determine the average total weight per Experiment (drawing with replacement).
- For which method (with or without replacement) are the events ="1g-ball drawn in first draw" and ="1g-ball drawn in second draw" independent?
- If three balls are drawn without replacement, what is then the probability to draw a total weight of ?
- A coin with and is flipped times.
- Draw the probability tree that represents this experiment. Indicate the branch probabilities.
- Determine , and justify why your calculation is correct.
- Determine the probabilities , , and .
- Based on the result above, what is the probability to observe exactly heads and tails?
- What type of experiment is this? Explain.
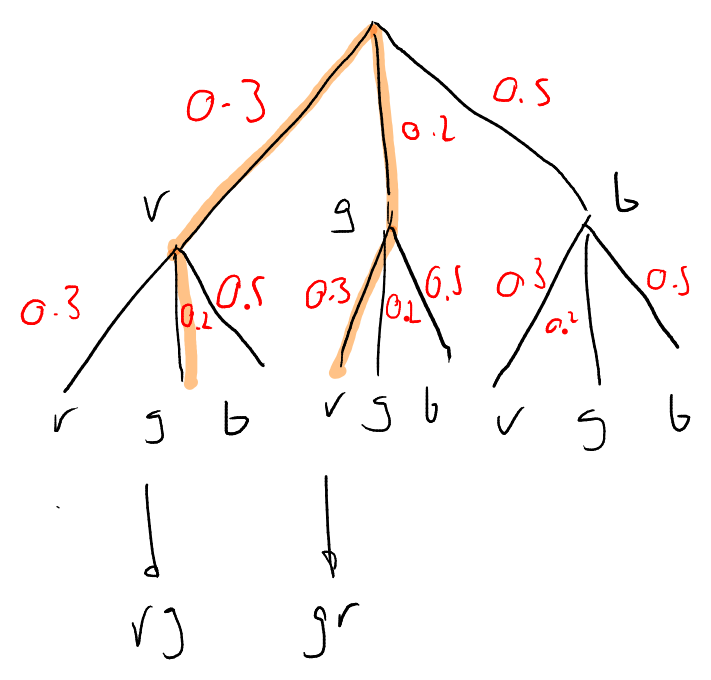
- A box contains red, green and black balls. You draw with replacement. In of the cases you draw red, in of the cases you draw green, and in of the cases you draw black.
- If you draw twice, what is the probability to draw one red and one green ball?
- If you draw six times, what is the probability to draw red balls?
- A fair die is rolled ten times. Determine the probability to observe
- five "6" followed by five other numbers.
- exactly three "6".
- more than three "6".
- more than three times but less than seven times shows the die a number bigger than .
- How often do you have to roll the die so that the probability for observing at least one "6" is (or very close to it).
Show
Solutions C
- We have the following definitions:
- -factorial
calculates the number of permutation or arrangements of a word with different letters. For example, the word
REALcan be arranged in different ways. - If some of the characters are the same, we have the MISSISSIPPI-problem. The number of unique arrangements of the word
MISSISSIPPIis - The binomial coefficient ("n choose k") denotes the number arrangements of a word with letters contains
HandT. For example, the number of arrangements of the wordHHHHTTTHTTHHis denoted by Using the MISSISSIPPI-formula, we get
- -factorial
calculates the number of permutation or arrangements of a word with different letters. For example, the word
- We have
- , because there is only one arrangement of the word
HHHHHH....H. - , because there is only one arrangement of the word
TTTTTT....T. - , because there are arrangements of the word
HTTTTT....T(you can shift theHto any of the positions in the word).
- , because there is only one arrangement of the word
- We have
-
- All paths leading to 6g are indicated in the figure above (top row, yellow). We have to add them:
- with replacement:
- without replacement:
- Let be the total weight.
- With replacement, as it should be intuitively clear. To show it formally, we have to show, for example, that . With replacement, we get (see tree above) and as well. So and are independent. We could have shown as well that or that . They are all tests for independence. Now let's look at the case where we do not replace the balls. We get (see tree above) and Thus, and are dependent.
- See tree at the bottom, the relevant paths are in yellow:
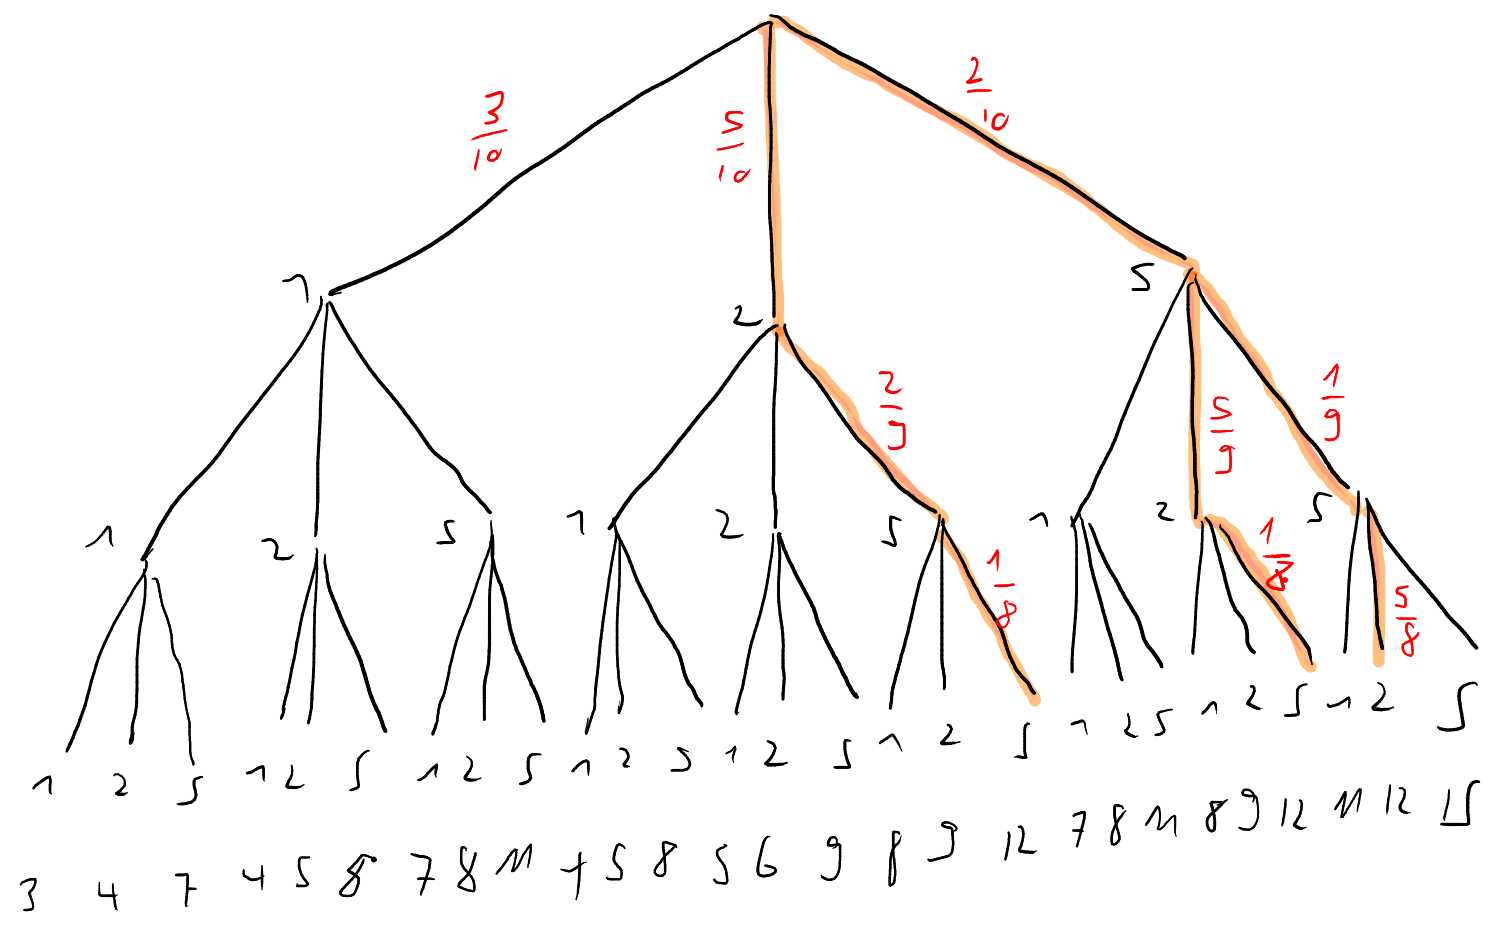
-
- We have:
-
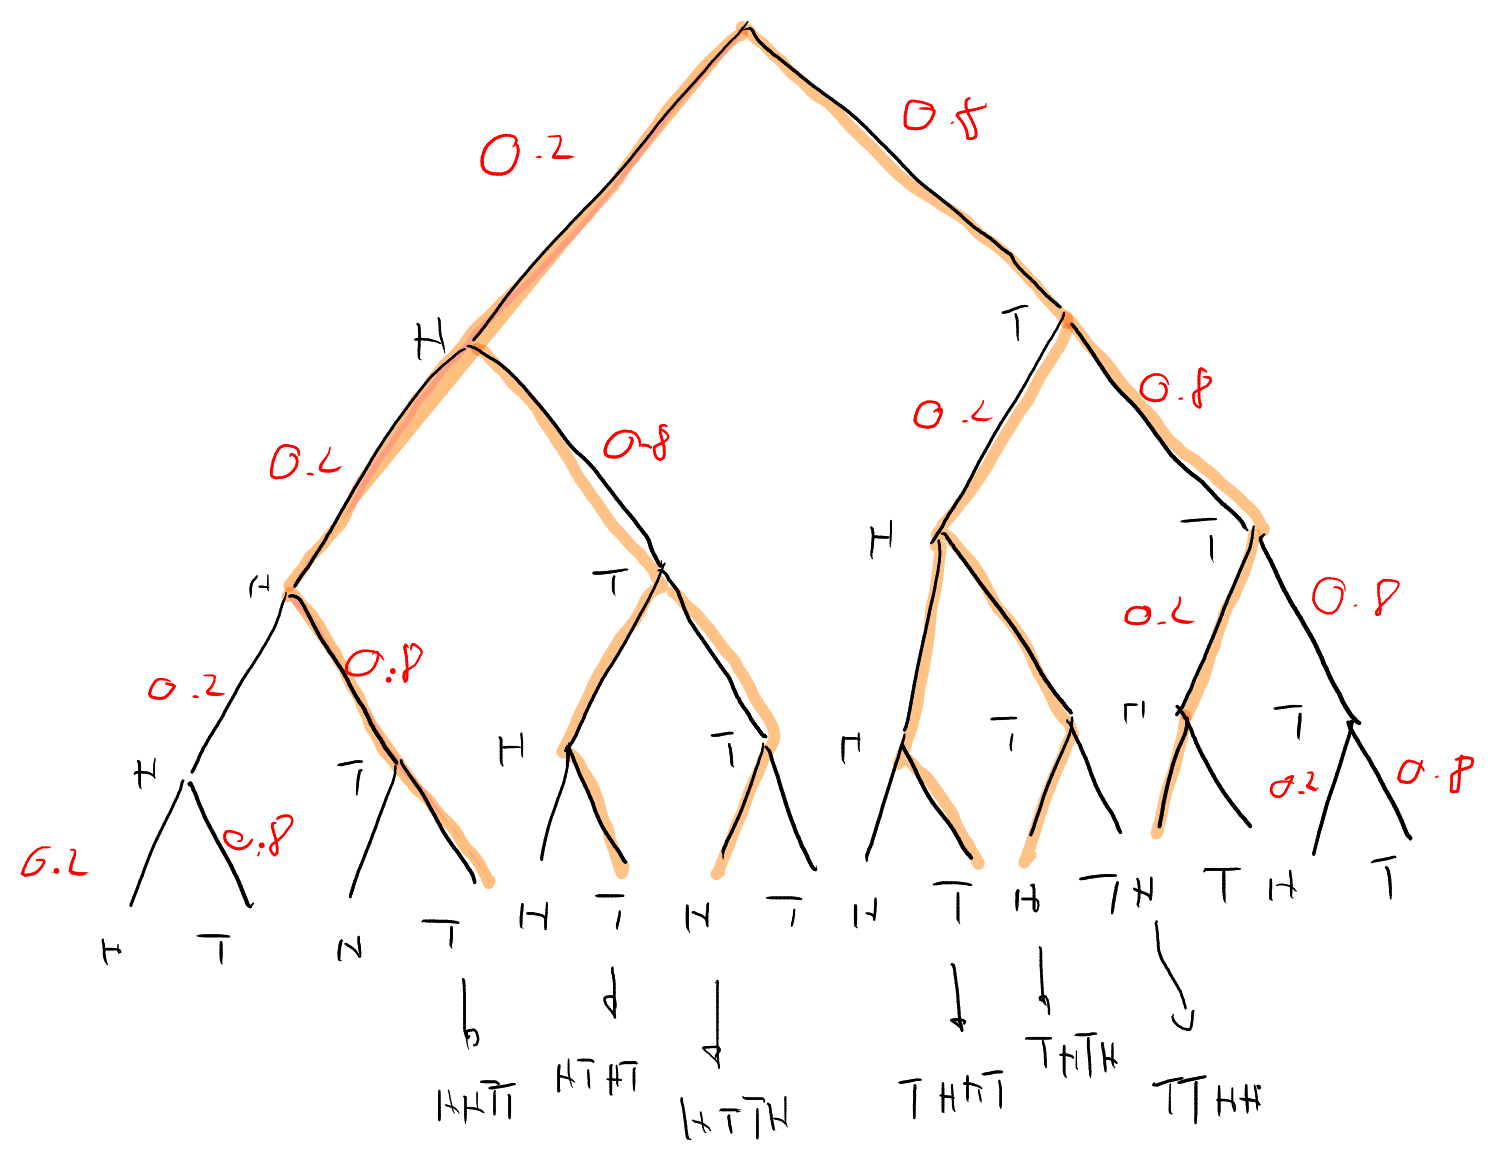
- The tree is shown below. 2. With ="head in first flip", ="tail in second flip", ="head in third flip", ="tail in fourth flip", and because the events are independent, we have
- With the same argument as above we get
- Let ="number of heads. We have (see tree)
- This is a binomial experiment, where the number of repetitions is , and the Bernoulli experiment is "flipping a coin", with success probability (head). Thus, we have
-
- We have
- (see tree below).
- Binomial experiment, where the Bernoulli experiment with success probability (red) is repeated times. Thus,
Or use
- Binomial experiment with repetition of the Bernoulli experiment with success probability (a six). Denote by the number of observed "6".
- (probability to observe number ). Thus
- Find with . Because of and we have to solve the equation So .
D. Random variables and distributions, normal distribution
-
What is a random variable? What types are there?
-
You play a game which you can win with probability . If you win you get CHF, otherwise you lose CHF.
- ="amount won". Is this a discrete or a continuous random variable? What is the probability distribution of ?
- Determine the mean of . Is this a fair game, in the sense that on average you will neither win nor loose money?
- If you play the game, by how much does the typical amount of money you win per game deviate from this mean?
-
You play a game with a biased coin (). The number of times you play is .
- Let denote the number of heads. What is the probability distribution of ?
- If head occurs, you win CHF, otherwise you lose CHF. How much will you win on average after these twenty games?
-
What is a continuous probability distribution function? Explain.
-
Consider a random variable with the continuous probability distribution function
where is a constant.
- Find .
- Determine the probability
- Determine the average and the standard deviation of .
-
The table below shows the height (in ) of pupil.
- Determine and sketch the histogram of the heights.
- Sketch the corresponding normal distribution in the same coordinate system. The mean of the heights is , the standard deviation is .
- Also, based on the normal distribution, determine the probability that a randomly selected pupil has a height between and , and also the probability that the height is smaller than .
Show
Solutions D
- A random variable is a function which maps every outcome of a sample space to a numerical value. If the numerical values are discrete (e.g. ) we call the random variable discrete. If the numerical values can be any value in a given interval (e.g. measurement values), we call the random variable continuous.
- Random variable is the amount of money you win.
- is is discrete, as it can take on the values and . The distribution of this random variable is
- The average amount you win is So it is not a fair game, on average you win CHF.
- The typical deviation from this mean is
- Let be the number of heads (this is a discrete random variable). It is a binomial experiment, where the Bernoulli experiment with success probability ) is repeated times.
- The probability distribution is where .
- The average number of heads is . So on average you win times, and lose times. Thus, the average win is
- Consider a continuous random variable . The probability distribution function of is the function that emerges if we make the class width of the histogram of a continuous random variable (or continuous data) smaller and smaller. In particular, the area under the graph of is the probability:
- The antiderivative of is .
- The area under the curve has to be (, because no other values are possible for ). So we have
- , thus
- Let denote the height of the pupils (continuous random variable).
-
The class width is , the number of pupils is . Thus, the relative frequency and the density are
The histogram is shown below.
-
The normal distribution has the parameters and (that is, ). The highest point is at . The sketch of the graph is shown below.
-
(use calculator
normcdfto calculate integral).(again, use
normcdf, instead of use or so.)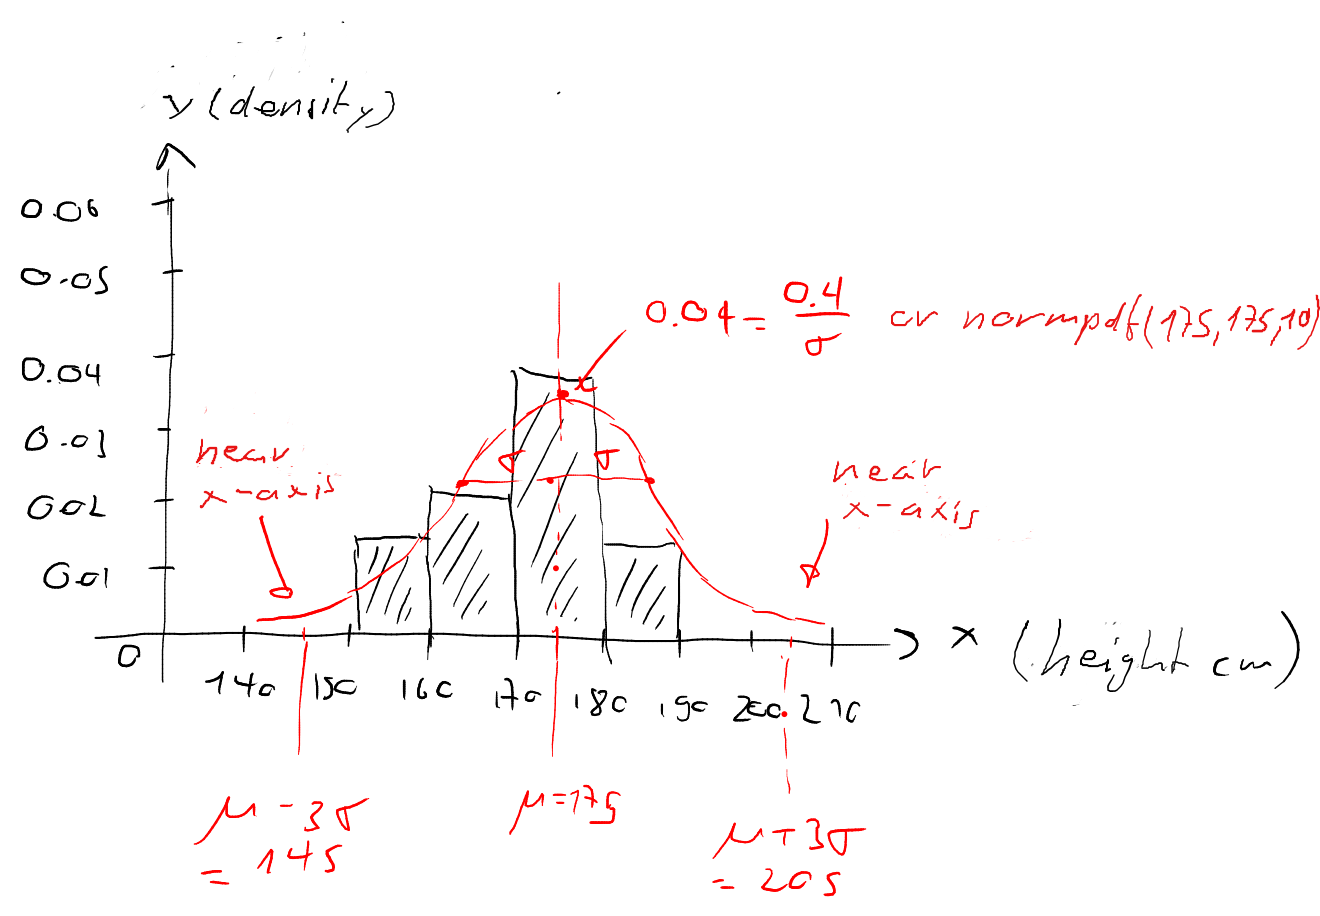
-
E. Pokémon TCG
In the mobile game Pokémon TCG Pocket, you can open digital booster packs of 5 Pokémon cards. The rarest card in the "Mythical Island" theme pack is the Mew Ex Gold (only called Mew from here on).
Each time you open a pack, it is randomly assigned to be either a regular pack (99.95%) or a rare pack (0.05%). The five cards in the pack are then generated. Usually the first cards are the most common cards and the rare cards appear as one of the last cards in a pack.
In a regular pack, the fourth card has a 0.04% chance of being Mew; the fifth card has a 0.16% chance of being Mew. The other cards will never be Mew. In a rare pack, every card has a probability of to be Mew.
Each card is independent from the other. In particular, it is possible that two cards are the same.
Determine the probability...
-
...that there is at least one Mew in a regular pack.
-
...that there is exactly one Mew in a regular pack.
-
...that there is at least one Mew in a rare pack.
-
...that there is exactly one Mew in a rare pack.
-
...that there is at least one Mew in a random pack you open.
-
...that there is exactly one Mew in a random pack you open.
-
How many packs do you have to open, so that the probability to get at least one Mew is at least 90%?
Show
Solutions E
- or
- You need to open at least 1084 booster packs: